


 文章介绍了如何使用ECharts库在JavaScript中实现数据的动态拆分,将数据分为两部分分别显示在两个Y轴上,同时处理了tooltip在数据为空时的显示问题。
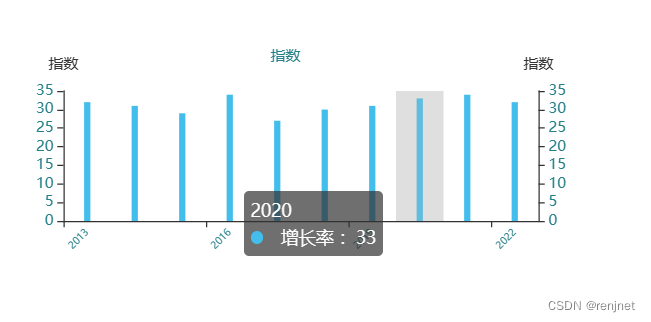
先看展示效果
代码如下:
var loadTest = function () {
    var valueHistoryData = {
        showName: "指数",
        yAxisName: "指数",
        xAxisDate: ['2013', '2014', '2015', '2016', '2017', '2018', '2019', '2020', '2021', '2022'],
        seriesData: [
            {
                name: '增长率',
                type: 'bar',
                stack: '指数',
                barWidth: 5,// 柱形的宽度
                data: [32, 31, 29, 34, 27, '', '', '', '', ''],
                itemStyle: { normal: { color: "#43bdec" } }
            },
            {
                yAxisIndex: 1,
                name: '增长率',
                type: 'bar',
                stack: '指数',
                barWidth: 5,// 柱形的宽度
                data: ['', '', '', '', '', 30, 31, 33, 34, 32],
                itemStyle: { normal: { color: "#43bdec" } }
            }
        ]

    };

    var echatDom = document.getElementById("chart_info_gauge");
    if (echatDom) {
        var showName = valueHistoryData.showName;
        if (showAreaName) {
            showName += "(" + showAreaName + ")";
        }
        var echartsDiag = echarts.init(echatDom);
        echartsDiag.dispose();
        var echartsDiag = echarts.init(echatDom);
        var Option = {
            title: {
                show: true,
                text: showName,
                x: 'center',
                y: 2,
                textStyle: {
                    color: '#268088',
                    fontSize: 12,
                    fontWeight: 'normal'
                }
            },
            tooltip: {
                trigger: 'axis',
                axisPointer: {
                    type: 'shadow'
                },
                formatter: function (params) {
                    var res = `${params[0].name} <br/>`
                    for (const item of params) {
                        console.log(params);
                        if (item.value) {
                            res += `<span style="background: ${item.color}; height:10px; width: 10px; border-radius: 50%;display: inline-block;margin-right:10px;"></span> ${item.seriesName} :${item.value}<br/>`
                        }
                    }
                    return res;
                }
            },
            legend: {
                show: false
            },
            grid: {
                x: 50,
                y: 40,
                x2: 25,
                y2: 56,
                borderWidth: 0
            },
            xAxis: [
                {
                    type: 'category',
                    nameTextStyle: { color: "#268088", fontSize: 12 },
                    axisLabel: { show: true, interval: 2, textStyle: { color: "#268088", fontSize: 8 }, rotate: 45 },//坐标轴刻度标签的相关设置。
                    data: valueHistoryData.xAxisDate
                }
            ],
            yAxis: [
                {
                    name: showName,
                    type: 'value',
                    splitLine: { show: false },
                    axisLabel: {
                        textStyle: {
                            color: '#268088'
                        }
                    }
                },
                {
                    name: showName,
                    type: 'value',
                    splitLine: { show: false },
                    axisLabel: {
                        textStyle: {
                            color: '#268088'
                        }
                    }
                }
            ],
            series: valueHistoryData.seriesData
        };
        echartsDiag.setOption(Option, true);
    }
}

loadTest();
最关键的部分是原始数据的拆分,分成2个部分,然后页面显示的时候,第一个部分放第一个Y轴,并且清空后续数据,第二个部分放第二个Y轴,清空前部分数据。剩下的就是tooltip里数据为空时不显示即可。


 782
782

 被折叠的 条评论
为什么被折叠?
被折叠的 条评论
为什么被折叠?
 到【灌水乐园】发言


