
clear
clc
close all
% 设置参数
Fs = 100; % 采样率(赫兹)
T = 10; % 信号持续时间(秒)
t = 0:1/Fs:T-1/Fs; % 时间向量
% 生成非均匀风速信号
mean_wind_speed = 5; % 平均风速(米/秒)
wind_speed_variation = 2; % 风速波动范围(标准差)
wind_speed = mean_wind_speed + wind_speed_variation * randn(size(t)); % 正态分布随机噪声
% 进行风速信号的频谱分析
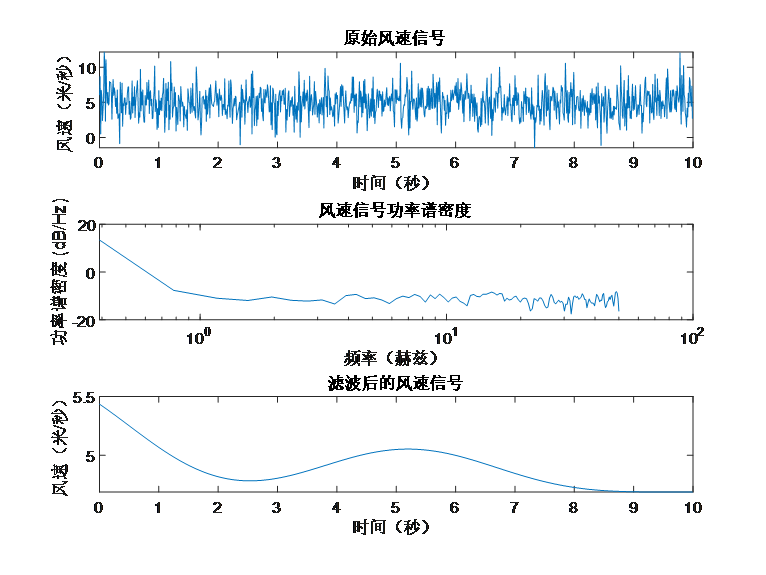
figure;
subplot(3,1,1);
plot(t, wind_speed);
title('原始风速信号');
xlabel('时间(秒)');
ylabel('风速(米/秒)');
subplot(3,1,2);
[pxx, f] = pwelch(wind_speed, [], [], [], Fs);
semilogx(f, 10*log10(pxx)); % 使用log10为底的对数坐标
title('风速信号功率谱密度');
xlabel('频率(赫兹)');
ylabel('功率谱密度 (dB/Hz)');
% 对风速信号进行滤波处理
cutoff_frequency = 0.2; % 截止频率(赫兹)
[b, a] = butter(4, cutoff_frequency/(Fs/2), 'low'); % 低通滤波器设计
filtered_wind_speed = filtfilt(b, a, wind_speed);
% 绘制滤波后的风速信号
subplot(3,1,3);
plot(t, filtered_wind_speed);
title('滤波后的风速信号');
xlabel('时间(秒)');
ylabel('风速(米/秒)');
% 计算滤波后风速信号的功率谱密度
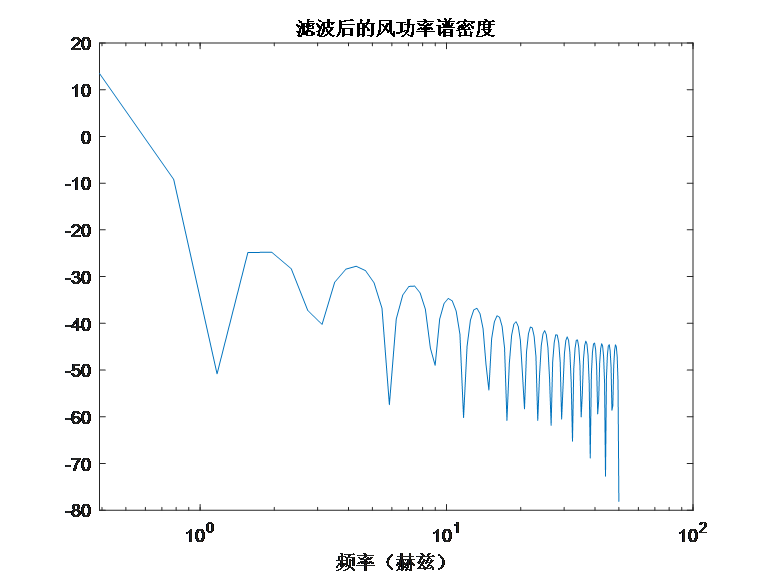
figure;
[pxx_filtered, f_filtered] = pwelch(filtered_wind_speed, [], [], [], Fs);
semilogx(f_filtered, 10*log10(pxx_filtered)); % 使用log10为底的对数坐标
title('滤波后的风功率谱密度');
xlabel('频率(赫兹)');
ylabel('功率谱密度 (dB/Hz)');


 本文介绍了如何使用MATLAB生成非均匀风速信号,进行频谱分析,设计并应用低通滤波器,以及对比滤波前后风速信号的功率谱密度。


