


一、echarts的基础概念
1、什么是echarts
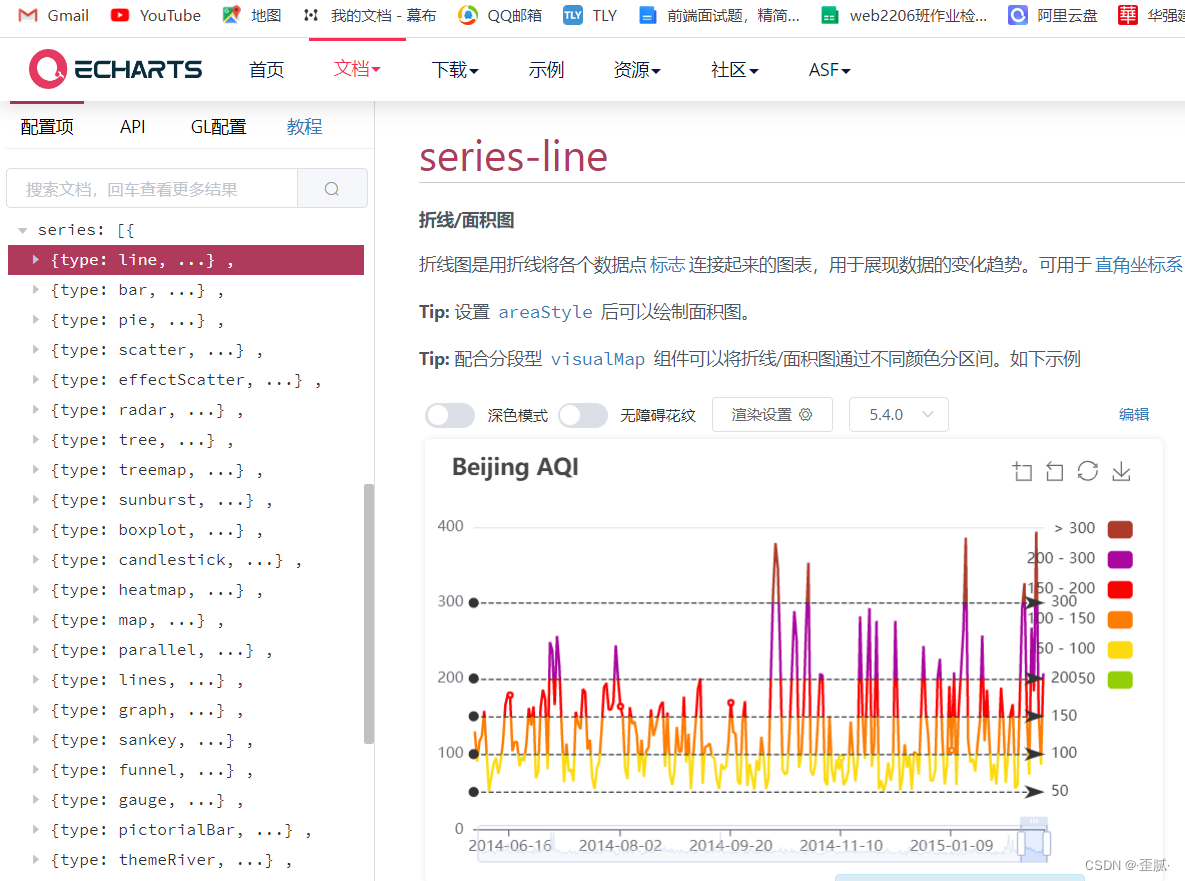
ECharts是一款基于JavaScript的数据可视化图表库,提供直观,生动,可交互,可个性化定制的数据可视化图表。ECharts最初由百度团队开源,并于2018年初捐赠给Apache基金会,变成了免费开源。
与echats同竞争的还有heightCharts和D3
2、使用echats的好处
更好的通过图表展示数据(大数据可视化)
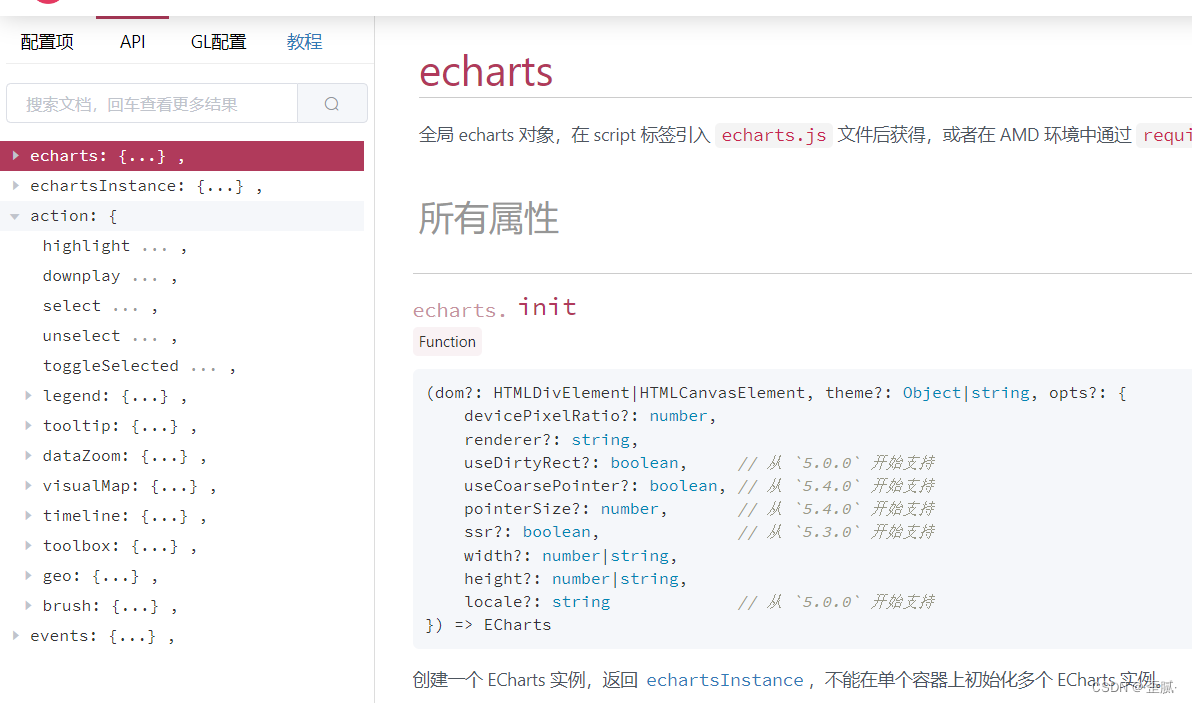
3、echarts中常用的术语
- tooltip:图标的提示
- title:标题
- legend图例
- xAxis、yAxis轴线
- tooltip提示
- toolbox工具箱
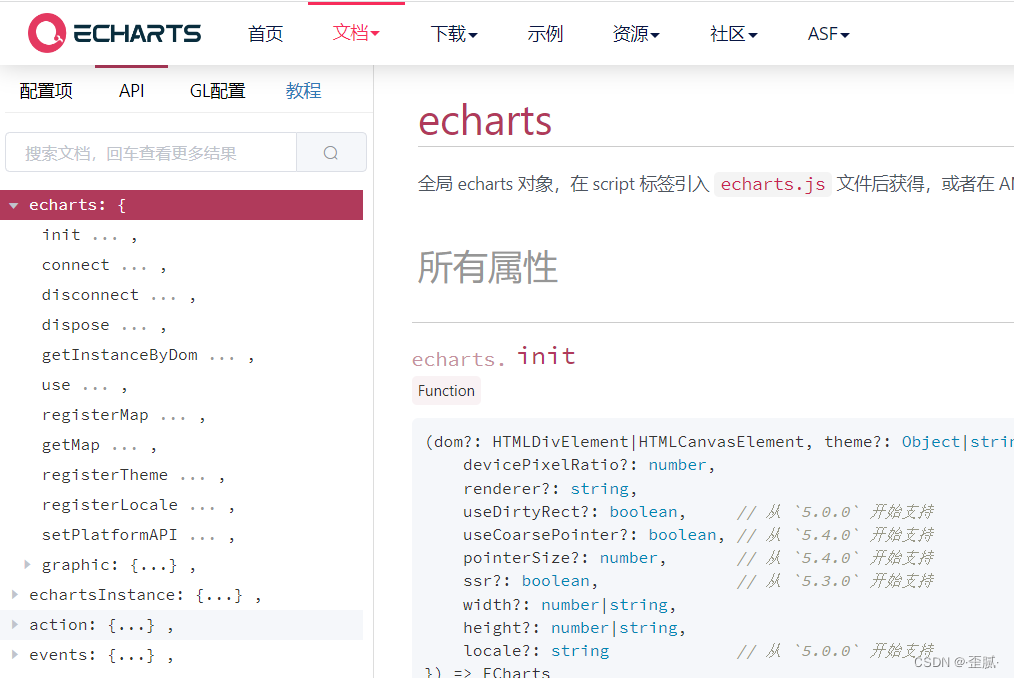
4、网站
https://echarts.apache.org/zh/cheat-sheet.html
二、常见的图表
1、pie 饼状图
<!DOCTYPE html>
<html lang="en">

<head>
    <meta charset="UTF-8">
    <meta http-equiv="X-UA-Compatible" content="IE=edge">
    <meta name="viewport" content="width=device-width, initial-scale=1.0">
    <title>第er个小图表</title>
</head>
<!-- 01 导入js -->
<script src="js/echarts.min.js">

</script>
<script src="js/dark.js"></script>
<!-- 03 设置样式 -->
<style>
    #container {
        width: 800px;
        height: 600px;
    }
</style>

<body>
    <!-- 02 创建个容器 -->
    <div id="container"></div>
</body>
<script>
    // 04 实例化echarts
    // 4.1创建一个实例
    var echart = echarts.init(document.getElementById("container"), "dark")
    // 4.2定义配置项
    var option = {
        //图标的标题
        title: {
            text: "我的第一个图表"
        },
        // 图标的提示
        tooltip: {},
        //图例
        legend: { data: ["养猪个数"] },

        // x轴线
        xAxis: {},
        // y轴线
        yAxis: {},
        backgroundStyle: {
            color: 'rgba(0,0, 255, 0.2)'
        },
        //设置数据
        series: [
            {
                //数据名称
                name: '养猪个数',
                //类型为柱状图
                type: "pie",
                // redius: 2,
                radius: [80, 30],
                left: - 350,
                top: -220,
                //数据data
                data: [
                    { name: "林佬", value: 100, itemStyle: { color: "#0f0" } },
                    { name: "韩佬", value: 50 },
                    { name: "康佬", value: 60 },
                    {
                        name: "胡校长", value: 30, itemStyle: {
                            normal: { color: "#ababa0" },
                            emphasis: { color: "#bcff57" }
                        }
                    }
                ]
            }
        ]
    }
    // 4.3更新配置
    echart.setOption(option);
</script>

</html>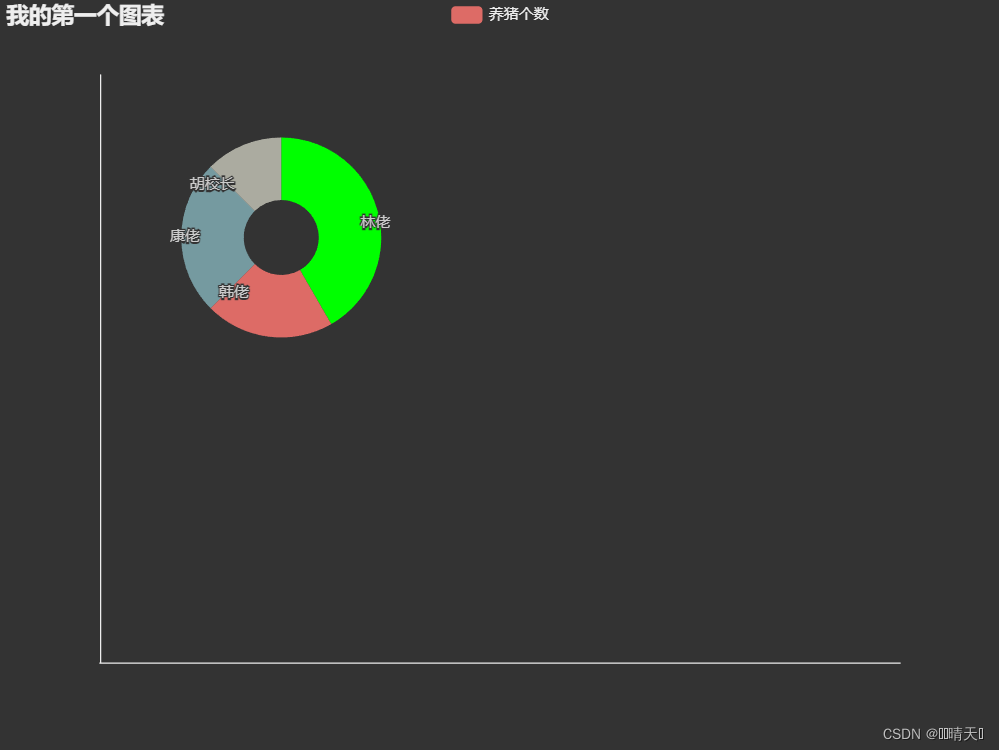
2、柱状图
<!DOCTYPE html>
<html lang="en">

<head>
    <meta charset="UTF-8">
    <meta http-equiv="X-UA-Compatible" content="IE=edge">
    <meta name="viewport" content="width=device-width, initial-scale=1.0">
    <title>第一个小图表</title>
</head>
<!-- 01 导入js -->
<script src="js/echarts.min.js">

</script>
<!-- 03 设置样式 -->
<style>
    #container {
        width: 800px;
        height: 600px;
    }
</style>

<body>
    <!-- 02 创建个容器 -->
    <div id="container"></div>
</body>
<script>
    // 04 实例化echarts
    // 4.1创建一个实例
    var echart = echarts.init(document.getElementById("container"))
    // 4.2定义配置项
    var option = {
        //图标的标题
        title: {
            text: "我的第一个图表"
        },
        // 图标的提示
        tooltip: {},
        //图例
        legend: { data: ["睡眠时长"] },

        // x轴线
        xAxis: { data: ["周一", "周二", "周三", "周四", "周五", "周六", "周日"] },
        // y轴线
        yAxis: {},
        //设置数据
        series: [
            {
                //数据名称
                name: '睡眠时长',
                //类型为柱状图
                type: "bar",
                //数据data
                data: [8, 10, 4, 24, 12, 24, 1]
            }
        ]
    }
    // 4.3更新配置
    echart.setOption(option);
    //charts 图标  set 设置  option 选项  bar 条(柱状条  series系列  Axis 轴线
    //legend 传奇(图例)  tooltip 提示   init 初始化
</script>

</html>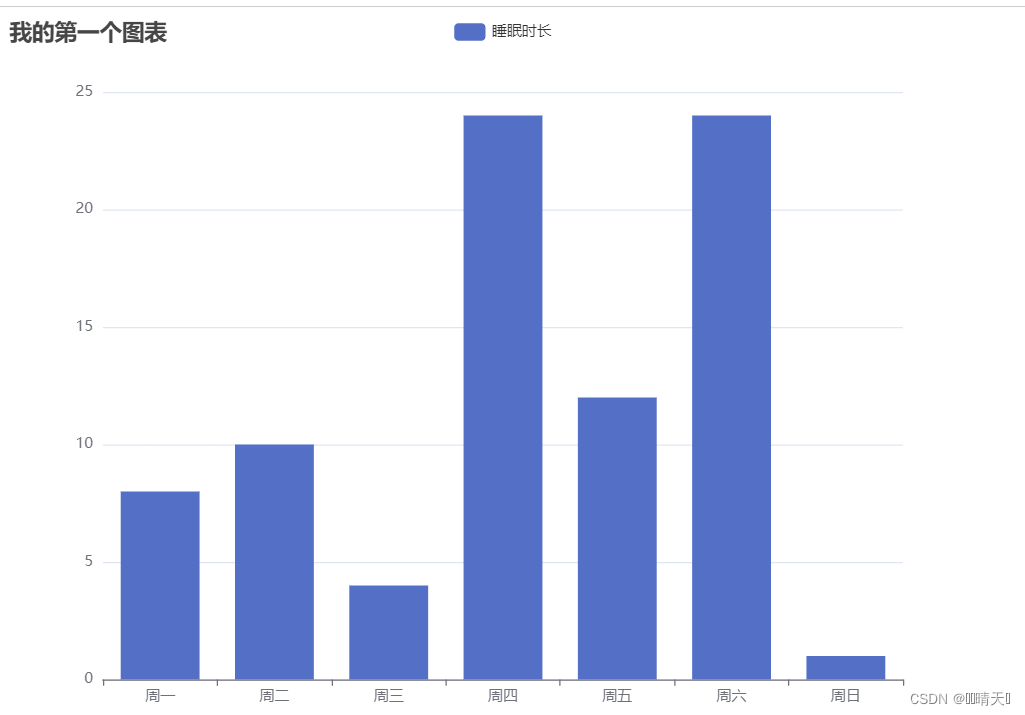
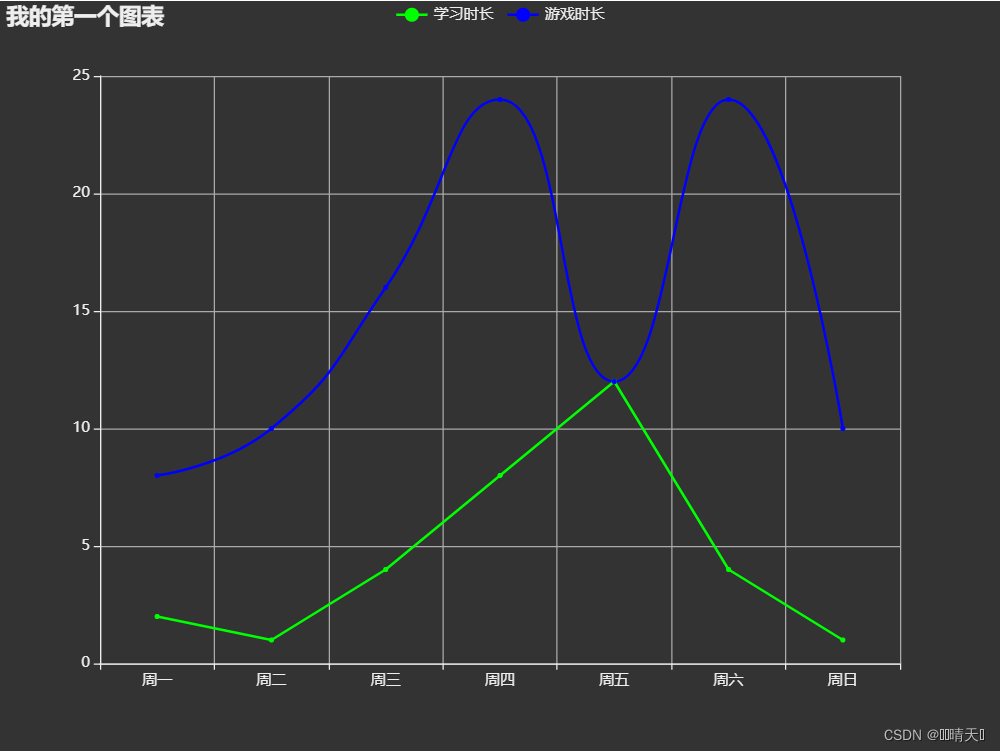
3、折线图
<!DOCTYPE html>
<html lang="en">

<head>
    <meta charset="UTF-8">
    <meta http-equiv="X-UA-Compatible" content="IE=edge">
    <meta name="viewport" content="width=device-width, initial-scale=1.0">
    <title>第er个小图表</title>
</head>
<!-- 01 导入js -->
<script src="js/echarts.min.js">

</script>
<script src="js/dark.js"></script>
<!-- 03 设置样式 -->
<style>
    #container {
        width: 800px;
        height: 600px;

    }
</style>

<body>
    <!-- 02 创建个容器 -->
    <div id="container"></div>
</body>
<script>
    // 04 实例化echarts
    // 4.1创建一个实例
    var echart = echarts.init(document.getElementById("container"), "dark")
    // 4.2定义配置项
    var option = {
        //图标的标题
        title: {
            text: "我的第一个图表"
        },
        // 图标的提示
        tooltip: {},
        //图例
        legend: { data: ["学习时长", "游戏时长"] },
        // x轴线
        xAxis: { data: ["周一", "周二", "周三", "周四", "周五", "周六", "周日"] },
        // y轴线
        yAxis: {},
        //设置数据
        series: [
            {
                //数据名称
                name: '学习时长',
                //类型为折线
                type: "line",
                //数据data
                data: [2, 1, 4, 8, 12, 4, 1],
                color: "#0f0",
            },
            {
                //数据名称
                name: '游戏时长',
                //类型为折线图
                type: "line",
                smooth: true,
                //数据data
                data: [8, 10, 16, 24, 12, 24, 10],
                // areaStyle: ["#ff0"]
                color: "#00f",
            },
        ]
    }
    // 4.3更新配置
    echart.setOption(option);
    //charts 图标  set 设置  option 选项  bar 条(柱状条  series系列  Axis 轴线
    //legend 传奇(图例)  tooltip 提示   init 初始化
</script>

</html>
三、主题颜色及特殊样式
1、主题样式
light
dark
自定义
https://echarts.apache.org/zh/theme-builder.html
2、特殊样式
渐变色的样式及其使用
//定义渐变
    var linear = {
        type: 'linear',
        x: 0,
        y: 0,
        x2: 0,
        y2: 1,
        colorStops: [{
            offset: 0, color: '#02bcff' // 0% 处的颜色
        }, {
            offset: 1, color: '#5555ff' // 100% 处的颜色
        }],
        global: false // 缺省为 false
    }


//使用
itemStyle: {
     color: linear,
     borderRadius: [30, 30, 0, 0] //圆角
}
3、rich 富文本
formatter: "{big|{d}}{small|%}\n{b}",
     rich: {
         big: {
            color: "#f70",
            fontSize: "48px",
            fontWeight: 900,
         },
         small: {
            color: "#f70",
         }
     }
4、堆叠
<!DOCTYPE html>
<html lang="en">

<head>
    <meta charset="UTF-8">
    <meta http-equiv="X-UA-Compatible" content="IE=edge">
    <meta name="viewport" content="width=device-width, initial-scale=1.0">
    <title>Doc</title>
</head>
<script src="js/echarts.min.js"></script>
<script src="js/dark.js"></script>
<!-- 03 设置样式 -->
<style>
    #container {
        width: 800px;
        height: 600px;
    }
</style>

<body>
    <div id="container"></div>
</body>
<script>
    var echart = echarts.init(document.getElementById("container"), "dark")
    var x = Math.floor(Math.random() * 100 + 1)
    var y = Math.floor(Math.random() * 100 + 1)
    var z = Math.floor(Math.random() * 100 + 1)
    var w = Math.floor(Math.random() * 100 + 1)
    var a = Math.floor(Math.random() * 100 + 1)
    var b = Math.floor(Math.random() * 100 + 1)
    var c = Math.floor(Math.random() * 100 + 1)
    var d = Math.floor(Math.random() * 100 + 1)
    var e = Math.floor(Math.random() * 100 + 1)
    var f = Math.floor(Math.random() * 100 + 1)
    var h = Math.floor(Math.random() * 100 + 1)
    var g = Math.floor(Math.random() * 100 + 1)
    var option = {
        title: { text: "综合素质" },
        legend: { data: ["陈佬", "韩佬", "胡校长", "林佬"] },
        tooltip: { trigger: "axis" },
        yAxis: { data: ["颜值", "女朋友个数", "财富"] },
        xAxis: {},
        series: [
            {
                name: '陈佬', type: 'bar', data: [x, y, z], stack: true,
                label: { show: true, position: "insideRight", formatter: '{a}\n{c}' }
            },
            {
                name: '韩佬', type: 'bar', data: [a, b, c], stack: true,
                label: { show: true, position: "insideRight", formatter: '{a}\n{c}' }
            },
            {
                name: '胡校长', type: 'bar', data: [d, e, w], stack: true,
                label: { show: true, position: "insideRight", formatter: '{a}\n{c}' }
            },
            {
                name: '林佬', type: 'bar', data: [f, h, g], stack: true,
                label: { show: true, position: "insideRight", formatter: '{a}\n{c}' }
            }
        ]
    }
    echart.setOption(option)
</script>

</html>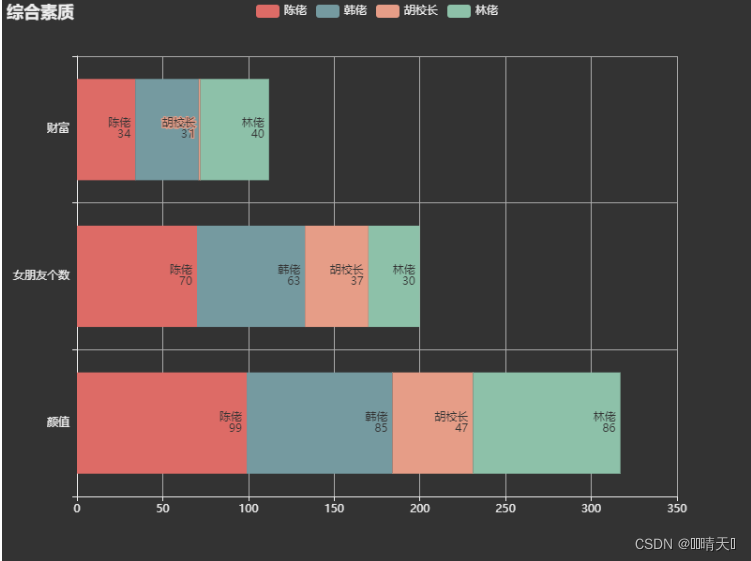
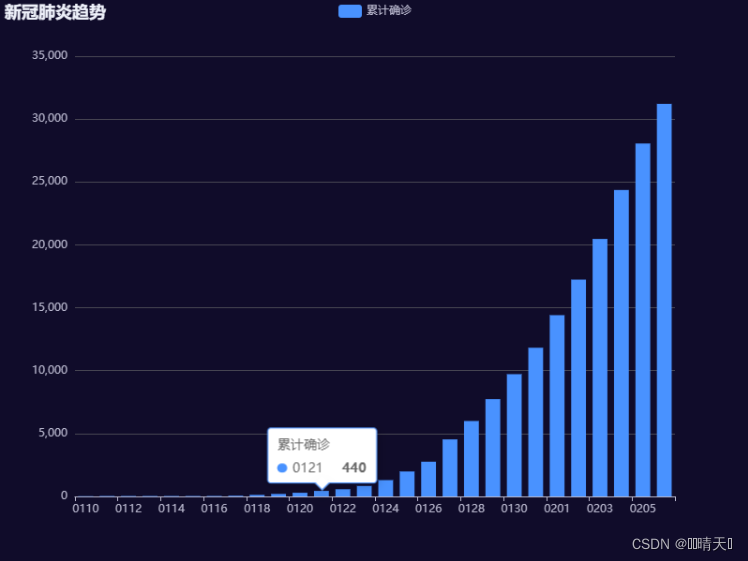
四、echarts的动态效果
1、自动播放
<!DOCTYPE html>
<html lang="en">

<head>
    <meta charset="UTF-8">
    <meta http-equiv="X-UA-Compatible" content="IE=edge">
    <meta name="viewport" content="width=device-width, initial-scale=1.0">
    <title>Document</title>
    <script src="./js/echarts.min.js"></script>
    <script src="./js/data.js" type="text/javascript"></script>
    <style>
        #container {
            width: 800px;
            height: 600px;
        }
    </style>
</head>

<body>
    <div id="container"></div>
</body>

<script>
    console.log(data);
    //sort排序 map映射 slice(-4)切割后4位
    var trends = data.data.trends.sort((a, b) => a.day - b.day);
    var echart = echarts.init(document.querySelector('#container'), "dark");
    var option = {
        title: { text: "新馆肺炎趋势" },
        legend: { data: ["累计确诊"] },
        tooltip: {},
        yAxis: {},
        xAxis: { data: trends.map(item => String(item.day).slice(-4)) },
        series: [
            {
                name: "累计确诊",
                type: "bar",
                data: trends.slice(0.20).map(item => item.sure_cnt)
            },
        ],
        // //每个执行延迟的时候(idx)就是下标,随着下标的增大延迟会长
        // animationDelay: function (idx) {
        //     //越往后数据延迟越大
        //     return idx * 200
        // },
        // animationDuration: function (idx) {
        //     return idx * 100
        // },
        // //弹性方式出先画面
        // animationEasing: "bounceInout"
    }

    //每三秒执行一次
    var id = setInterval(move, 3000)
    function move() {
        //删除第一个
        var first = trends.shift();
        //添加到最后
        trends.push(first);
        option.xAxis.data = trends.slice(0, 20).map(item => String(item.day).slice(-4))
        option.series[0].data = trends.slice(0, 20).map(item => item.sure_cnt);
        echart.setOption(option);
    }
    // echart.on("mouseover", function () {
    //     clearInterval(id)
    // })
    // //鼠标移出播放
    // echart.on("mouseout", function () {
    //     id = setInterval(move, 3000)
    // })
    echart.setOption(option);
</script>
2、 animation 动画弹起效果
 //每个执行延迟的时候(idx)就是下标,随着下标的增大延迟会长
         animationDelay: function (idx) {
             //越往后数据延迟越大
           return idx * 200
         },
         animationDuration: function (idx) {
             return idx * 100
        },
       //弹性方式出先画面
        animationEasing: "bounceInout"
3、发送一个提示效果
  var ind = 0;
    var id = setInterval(play, 3000);
    function play() {
        //发送一个显示提示的动作
        echart.dispatchAction({
            type: "showTip",
            //系列的index 在tooltip的trigger 为axis 的时候可选
            seriesIndex: 0,
            dataIndex: ind,
            position: "top"
        })
        ind++;
        if (ind >= 20) {
            ind = 0
        }
    }
五、总结
1、echarts官网:
 https://echarts.apache.org/zh/index.html
2、入门实例:
Handbook - Apache ECharts https://echarts.apache.org/handbook/zh/get-started/
3、使用类的方法
4、运用实例的方法
5、标签与事件
6、选项的配置:option的修改


 被折叠的 条评论
为什么被折叠?
被折叠的 条评论
为什么被折叠?
 到【灌水乐园】发言


