一. 数据处理
1. 数据导入
import os
import pandas as pd
from sqlalchemy import create_engine

engine = create_engine('mysql+pymysql://root:root@localhost:3306/db?charset=utf8')
# 用户:root
# 密码:root
# 服务器:localhost
# 端口号:3306
# 库名:db

# 指定目录
path = './data'
df = pd.DataFrame()  # 存储数据
for i in os.listdir(path):
    # 文件路径及名称
    name = os.path.join(path, i)
    # 单一文件的数据
    data = pd.read_excel(name)
    # 逐个插入DataFrame
    df = df.append(data, ignore_index=True)

df['houseInfo2'] = df['houseInfo2'].fillna('-').str.replace('\s', '')
df.to_sql('house_info', engine, index=False, if_exists='replace')
# The default value of regex will change from True to False in a future version
# 在未来的版本中,正则表达式的默认值将从True更改为False

# house_info 清洗前的表
sql = 'select * from db.house_info'
df = pd.read_sql(sql, con=engine)
df.to_excel('house_info.xlsx', index=False)
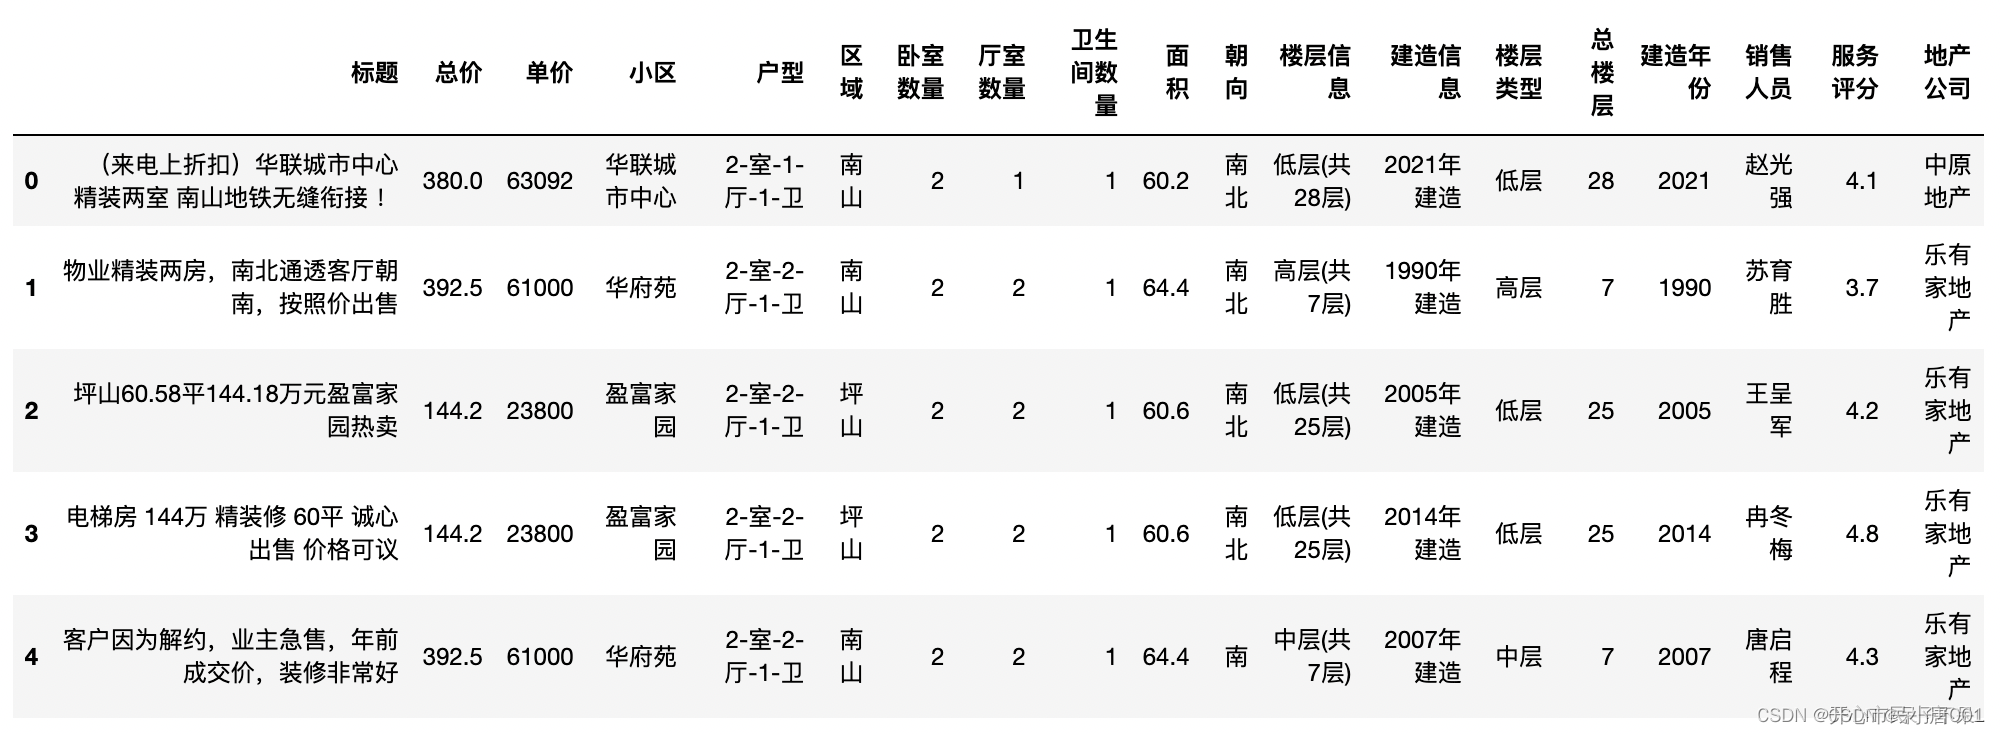
df.head()

2. 数据清洗
import pandas as pd
from sqlalchemy import create_engine

engine = create_engine('mysql+pymysql://root:root@localhost:3306/db?charset=utf8')
df = pd.read_sql('select * from db.house_info', engine)

df.info()
‘’‘
<class 'pandas.core.frame.DataFrame'>
RangeIndex: 6000 entries, 0 to 5999
Data columns (total 8 columns):
 #   Column         Non-Null Count  Dtype
---  ------         --------------  -----
 0   title          6000 non-null   object
 1   totalPrice     6000 non-null   float64
 2   unitPrice      6000 non-null   object
 3   positionInfo1  6000 non-null   object
 4   positionInfo2  6000 non-null   object
 5   houseInfo1     6000 non-null   object
 6   houseInfo2     6000 non-null   object
 7   saleInfo       6000 non-null   object
dtypes: float64(1), object(7)
memory usage: 375.1+ KB
’‘’

df.rename({
    'title': '标题',
    'totalPrice': '总价',
    'unitPrice': '单价',
    'positionInfo1': '小区',
    'houseInfo1': '户型'},
    axis=1,
    inplace=True)

# 从0开始索引,左闭(含)右开(不含)
df['区域'] = df['positionInfo2'].str[0:2]

# 2-室-1-厅-1-卫
df[['卧室数量', '厅室数量', '卫生间数量']] = df['户型'].str.extract(pat='(\d+)-室-(\d+)-厅-(\d+)-卫', expand=True)

# 60.2㎡-南北-低层(共28层)-2021年建造
df[['面积', '朝向', '楼层信息', '建造信息']] = df['houseInfo2'].str.split(pat='-', expand=True)

# "()"分组匹配,"\"转义,引用括号本身
df[['楼层类型', '总楼层']] = df['楼层信息'].str.extract(pat='(.*?)\(共(\d+)层\)', expand=True)

# \d:匹配数值,数量:{1,}
df['建造年份'] = df['建造信息'].str.extract(pat='(\d+)', expand=True)

df[['销售人员', '服务评分', '地产公司']] = df['saleInfo'].str.split(pat='-', expand=True)

df.drop(
    labels=['positionInfo2', 'houseInfo2', 'saleInfo'],
    axis=1,
    inplace=True)

# 清洗包含字符串单位的字段
df['单价'] = pd.to_numeric(df['单价'].str.replace('元/㎡', ''))    # to_numeric 转换为数字格式
df['面积'] = pd.to_numeric(df['面积'].str.replace('㎡', ''))
df['服务评分'] = pd.to_numeric(df['服务评分'].str.replace('分', ''), errors='coerce')    # errors='coerce' 异常数据返回空值

df['卧室数量'] = pd.to_numeric(df['卧室数量'])
df['厅室数量'] = pd.to_numeric(df['厅室数量'])
df['卫生间数量'] = pd.to_numeric(df['卫生间数量'])
df['总楼层'] = pd.to_numeric(df['总楼层'])

# 空值处理:forward向前填充, backward向后填充
# 服务评分(均值填充)
df['总楼层'].fillna(method='bfill', inplace=True)
df['楼层信息'].fillna(method='bfill', inplace=True)
df['建造信息'].fillna(method='bfill', inplace=True)
df['楼层类型'].fillna(method='bfill', inplace=True)
df['建造年份'].fillna(method='bfill', inplace=True)
df['地产公司'].fillna(method='bfill', inplace=True)
df['服务评分'].fillna(value=df['服务评分'].mean(), inplace=True)

df['总楼层'] = df['总楼层'].astype(int)
df['建造年份'] = df['建造年份'].astype(int)

# 查看某列的唯一值
df['区域'].unique()
'''
array(['南山', '坪山', '龙岗', '龙华', '福田', '大鹏', '宝安', '深圳', '罗湖', '布吉', '光明',
       '盐田'], dtype=object)
'''
# 或 set(df['区域'])
df = df[~(df['区域'] == '深圳')]

df['区域'].unique()
‘’‘
array(['南山', '坪山', '龙岗', '龙华', '福田', '大鹏', '宝安', '罗湖', '布吉', '光明', '盐田'],
      dtype=object)
’‘’

df.to_sql('house_data', engine, index=False, if_exists='replace')

# house_data 清洗后的表
sql = 'select * from db.house_data'
df = pd.read_sql(sql, con=engine)
df.to_excel('house_data.xlsx', index=False)
df.head() 
二. 配置静态资源服务
1.获取 pyecharts-assets 项目
下载链接:GitHub - pyecharts/pyecharts-assets: 🗂 All assets in pyecharts
下载 pyecharts-assets.zip 压缩包
2.安装扩展插件
1)解压 pyecharts-assets.rar ,将解压文件放到任意的目录中
2)在 pyecharts-assets 中开启终端 或 终端进入pyecharts-assets,如:cd pyecharts-assets
3)终端中依次运行:
jupyter nbextension install assets
jupyter nbextension enable assets/main
4)配置 pyecharts 全局 HOST
 # 只需要在顶部声明 CurrentConfig.ONLINE_HOST 即可
 from pyecharts.globals import CurrentConfig, OnlineHostType

 # OnlineHostType.NOTEBOOK_HOST 默认值为 http://localhost:8888/nbextensions/assets/
 CurrentConfig.ONLINE_HOST = OnlineHostType.NOTEBOOK_HOST

 # 接下来所有图形的静态资源文件都会来自刚启动的服务器
 from pyecharts.charts import Bar
 bar = Bar()
三. 折线图
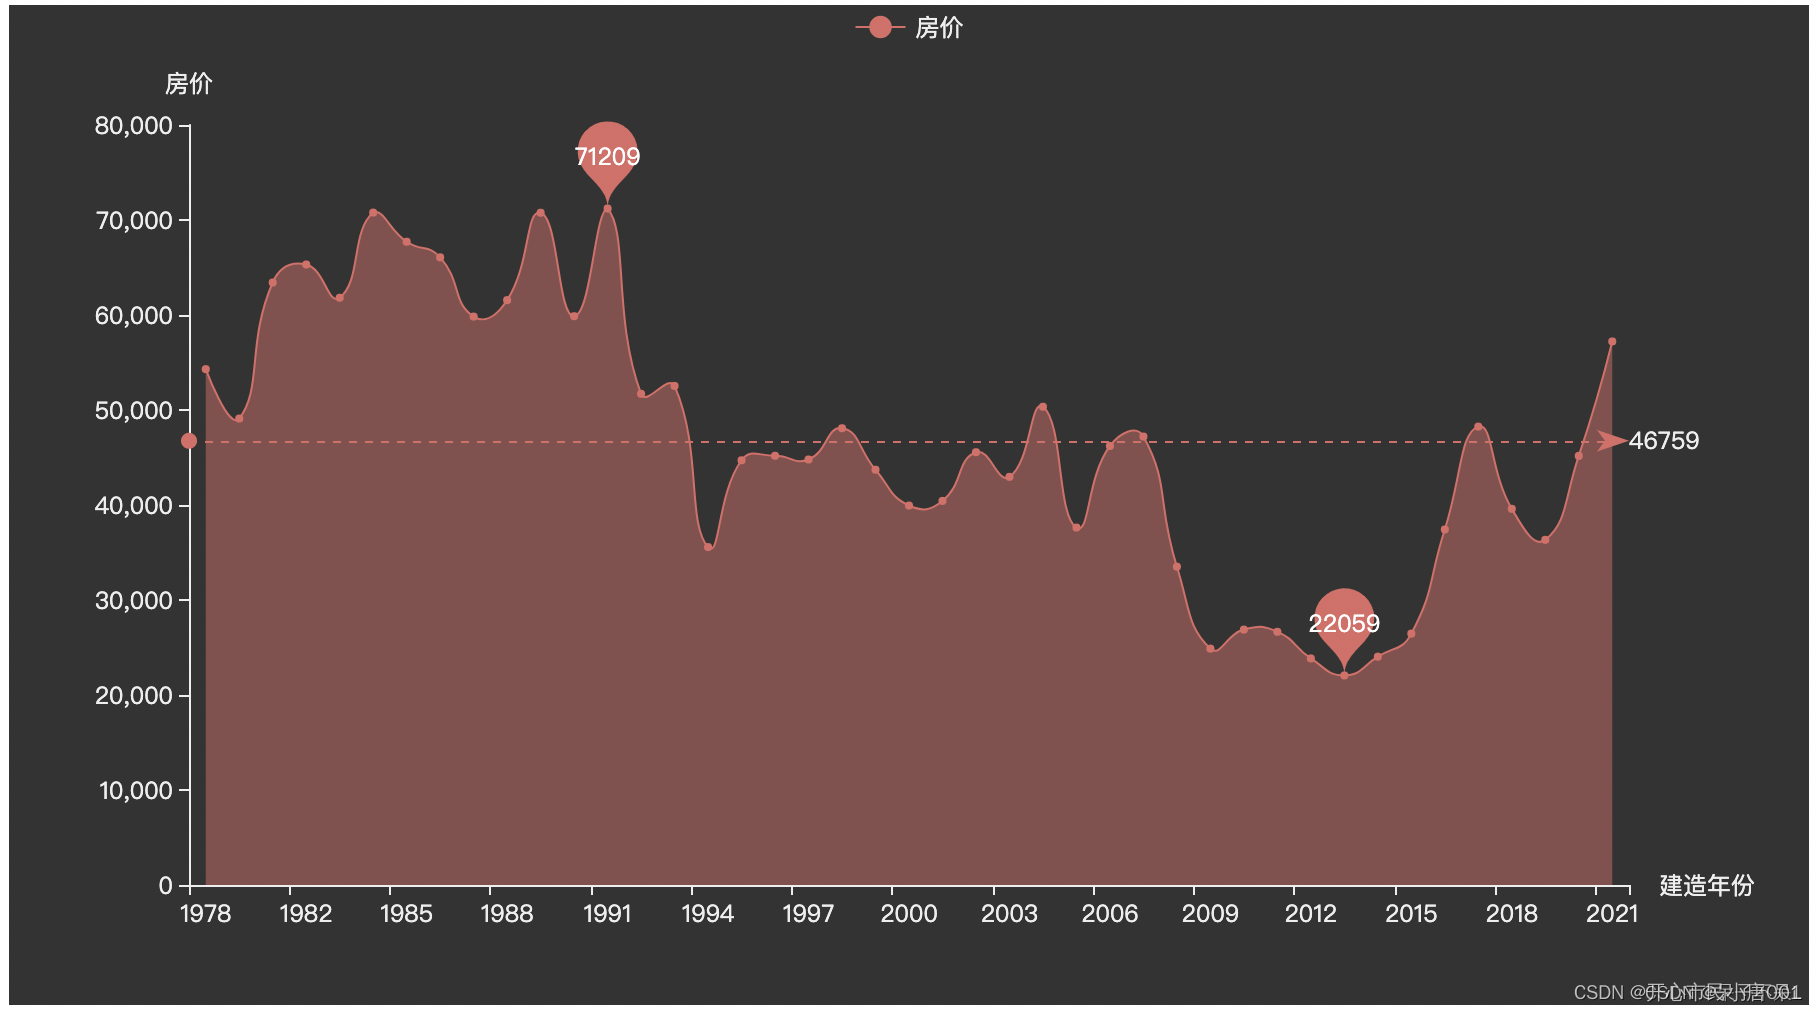
以建造年份分组,求单价的均值,并绘制折线图
# pyechats 官网:https://pyecharts.org/
# 图表示例网:https://gallery.pyecharts.org/

# 解压pyecharts-assets.rar
# 复制至某目录下,自定义目录

# pyecharts-assets目录下运行cmd

# 安装并激活插件
# jupyter nbextension install assets
# jupyter nbextension enable assets/main

from pyecharts.globals import CurrentConfig, OnlineHostType
CurrentConfig.ONLINE_HOST = OnlineHostType.NOTEBOOK_HOST


import numpy as np
import pandas as pd
from sqlalchemy import create_engine
from pyecharts.charts import *
from pyecharts import options as opts
from pyecharts.globals import ThemeType

engine = create_engine('mysql+pymysql://root:root@localhost:3306/db?charset=utf8')
df = pd.read_sql('select * from db.house_data', engine)
df.head()
# 只能将图片保存为网页形式
line.render('./图片/折线图.html')


 最低0.47元/天 解锁文章


 488
488

 被折叠的 条评论
为什么被折叠?


