


为了适配树莓派等系列的硬件开发版,我么一般将训练好的pt模型转换为onnx模型,这样会轻量化一点。
注意:一定要留意文件名称和路径,以及你在终端运行的路径。很多小白跑不起来一般这个问题
一,YoloV5
1.yolov5训练
有很多现成办法,后续再作补充,下载yolov5包之后导入到云服务器训练,几个数据就按照官方要求来,打好对应的标签。
dataset/
├── images/
│   ├── train/  # 训练集图片
│   └── val/    # 验证集图片
├── labels/
│   ├── train/  # 训练集标签
│   └── val/    # 验证集标签
└── data.yaml   # 数据集配置文件
mydata.yaml 文件内容如下
train: /path/to/dataset/images/train  # 训练集路径
val: /path/to/dataset/images/val      # 验证集路径

nc: 80  # 类别数量(数据集类别数量为 80,根据自己的类别来)
names: ['person', 'bicycle', 'car', ...]  # 类别名称
python3 train.py --weights yolov5s.pt --data data/mydata.yaml --workers 4 --batch-size 20 --epochs 50在终端输入以下指令将pt转onnx格式:(文件名注意改一下)
python export.py --weights yolov5s.pt --data data/coco.yaml --include onnxpython export.py --weight xxx.pt --include onnx2.yolov5使用
import cv2
import numpy as np
import onnxruntime as ort
import time
import random
def plot_one_box(x, img, color=None, label=None, line_thickness=None):
    """
    description: Plots one bounding box on image img,
                 this function comes from YoLov5 project.
    param:
        x:      a box likes [x1,y1,x2,y2]
        img:    a opencv image object
        color:  color to draw rectangle, such as (0,255,0)
        label:  str
        line_thickness: int
    return:
        no return
    """
    tl = (
        line_thickness or round(0.002 * (img.shape[0] + img.shape[1]) / 2) + 1
    )  # line/font thickness
    color = color or [random.randint(0, 255) for _ in range(3)]
    c1, c2 = (int(x[0]), int(x[1])),   (int(x[2]), int(x[3]))
    cv2.rectangle(img, c1, c2, color, thickness=tl, lineType=cv2.LINE_AA)
    if label:
        tf = max(tl - 1, 1)  # font thickness
        t_size = cv2.getTextSize(label, 0, fontScale=tl / 3, thickness=tf)[0]
        c2 = c1[0] + t_size[0], c1[1] - t_size[1] - 3
        cv2.rectangle(img, c1, c2, color, -1, cv2.LINE_AA)  # filled
        cv2.putText(
            img,
            label,
            (c1[0], c1[1] - 2),
            0,
            tl / 3,
            [225, 255, 255],
            thickness=tf,
            lineType=cv2.LINE_AA,
        )

def _make_grid( nx, ny):
        xv, yv = np.meshgrid(np.arange(ny), np.arange(nx))
        return np.stack((xv, yv), 2).reshape((-1, 2)).astype(np.float32)

def cal_outputs(outs,nl,na,model_w,model_h,anchor_grid,stride):

    row_ind = 0
    grid = [np.zeros(1)] * nl
    for i in range(nl):
        h, w = int(model_w/ stride[i]), int(model_h / stride[i])
        length = int(na * h * w)
        if grid[i].shape[2:4] != (h, w):
            grid[i] = _make_grid(w, h)

        outs[row_ind:row_ind + length, 0:2] = (outs[row_ind:row_ind + length, 0:2] * 2. - 0.5 + np.tile(
            grid[i], (na, 1))) * int(stride[i])
        outs[row_ind:row_ind + length, 2:4] = (outs[row_ind:row_ind + length, 2:4] * 2) ** 2 * np.repeat(
            anchor_grid[i], h * w, axis=0)
        row_ind += length
    return outs

def post_process_opencv(outputs, model_h, model_w, img_h, img_w, thred_nms, thred_cond):
    conf = outputs[:, 4].tolist()
    c_x = outputs[:, 0] / model_w * img_w
    c_y = outputs[:, 1] / model_h * img_h
    w = outputs[:, 2] / model_w * img_w
    h = outputs[:, 3] / model_h * img_h
    p_cls = outputs[:, 5:]

    if len(p_cls.shape) == 1:
        p_cls = np.expand_dims(p_cls, 1)
    cls_id = np.argmax(p_cls, axis=1)

    p_x1 = np.expand_dims(c_x - w / 2, -1)
    p_y1 = np.expand_dims(c_y - h / 2, -1)
    p_x2 = np.expand_dims(c_x + w / 2, -1)
    p_y2 = np.expand_dims(c_y + h / 2, -1)
    areas = np.concatenate((p_x1, p_y1, p_x2, p_y2), axis=-1)

    areas = areas.tolist()
    ids = cv2.dnn.NMSBoxes(areas, conf, thred_cond, thred_nms)

    # 计算中心坐标并返回
    centers = []
    if len(ids) > 0:
        for i in ids.flatten():
            center = (c_x[i], c_y[i])  # 计算中心坐标
            centers.append(center)
        return np.array(areas)[ids], np.array(conf)[ids], cls_id[ids], centers
    else:
        return [], [], [], []

def infer_img(img0, net, model_h, model_w, nl, na, stride, anchor_grid, thred_nms=0.4, thred_cond=0.5):
    # 图像预处理
    img = cv2.resize(img0, [model_w, model_h], interpolation=cv2.INTER_AREA)
    img = cv2.cvtColor(img, cv2.COLOR_BGR2RGB)
    img = img.astype(np.float32) / 255.0
    blob = np.expand_dims(np.transpose(img, (2, 0, 1)), axis=0)

    # 模型推理
    outs = net.run(None, {net.get_inputs()[0].name: blob})[0].squeeze(axis=0)

    # 输出坐标矫正
    outs = cal_outputs(outs, nl, na, model_w, model_h, anchor_grid, stride)

    # 检测框计算
    img_h, img_w, _ = np.shape(img0)
    boxes, confs, ids, centers = post_process_opencv(outs, model_h, model_w, img_h, img_w, thred_nms, thred_cond)

    return boxes, confs, ids, centers

if __name__ == "__main__":

    # 模型加载
    model_pb_path = "best.onnx"
    so = ort.SessionOptions()
    net = ort.InferenceSession(model_pb_path, so)

    # 标签字典
    dic_labels= {0:"harmfulWaste",
            1:"RecyclableWaste",
            2:"KitchenWaste",
            3:"OtherWaste"
            }

    # 模型参数
    model_h = 640    #树莓派和电脑上应该改为640
    model_w = 640
    nl = 3
    na = 3
    stride=[8.,16.,32.]
    anchors = [[10, 13, 16, 30, 33, 23], [30, 61, 62, 45, 59, 119], [116, 90, 156, 198, 373, 326]]
    anchor_grid = np.asarray(anchors, dtype=np.float32).reshape(nl, -1, 2)

    video = 0
    cap = cv2.VideoCapture(video)
    flag_det = False
    while True:
        success, img0 = cap.read()
        if success:
            if flag_det:
                t1 = time.time()
                det_boxes, scores, ids, centers = infer_img(img0, net, model_h, model_w, nl, na, stride, anchor_grid, thred_nms=0.4, thred_cond=0.5)
                t2 = time.time()

                for box, score, id, center in zip(det_boxes, scores, ids, centers):
                    label = '%s:%.2f' % (dic_labels[id], score)
                    print(f"Center: {center}")  # Output center'xy
                    print(label)

                    plot_one_box(box.astype(np.int16), img0, color=(255, 0, 0), label=label, line_thickness=None)

                str_FPS = "FPS: %.2f" % (1. / (t2 - t1))
                cv2.putText(img0, str_FPS, (50, 50), cv2.FONT_HERSHEY_COMPLEX, 1, (0, 255, 0), 3)

            cv2.imshow("video", img0)
        key = cv2.waitKey(1) & 0xFF
        if key == ord('q'):
            break
        elif key & 0xFF == ord('s'):
            flag_det = not flag_det
            print(flag_det)

    cap.release()


    # # 进行推理
    # img0 = cv2.imread('3.jpg')
    # t1 = time.time()
    # det_boxes,scores,ids = infer_img(img0,net,model_h,model_w,nl,na,stride,anchor_grid,thred_nms=0.4,thred_cond=0.5)
    # t2 = time.time()
    # print("%.2f"%(t2-t1))
    # 结果绘图
    # for box,score,id in zip(det_boxes,scores,ids):
        # label = '%s:%.2f'%(dic_labels[id],score)

        # plot_one_box(box.astype(np.int), img0, color=(255,0,0), label=label, line_thickness=None)
    # cv2.imshow('img',img0)

    # cv2.waitKey(0)


    # img = cv2.resize(img0, [320,320], interpolation=cv2.INTER_AREA)

    # img = cv2.cvtColor(img, cv2.COLOR_BGR2RGB)
    # img = img.astype(np.float32) / 255.0
    # blob = np.expand_dims(np.transpose(img, (2, 0, 1)), axis=0)

    # outs = net.run(None, {net.get_inputs()[0].name: blob})[0].squeeze(axis=0)

    # nl = 3
    # na = 3
    # stride=[8.,16.,32.]
    # anchors = [[10, 13, 16, 30, 33, 23], [30, 61, 62, 45, 59, 119], [116, 90, 156, 198, 373, 326]]
    # anchor_grid = np.asarray(anchors, dtype=np.float32).reshape(nl, -1, 2)
    # model_w = 320
    # model_h = 320
    # outs = cal_outputs(outs,nl,na,model_w,model_h,anchor_grid,stride)

    # print(outs)
    # boxes,confs,ids = post_process_opencv(outs,model_h,model_w,img_h=480,img_w=640,thred_nms=0.4,thred_cond=0.5)
    # print(boxes)
二,YoloV8
下载ultralytics
pip install ultralytics下载好之后像上面一样弄好图片和标签,以及类似的yaml文件,然后开始训练。
1.yolov8训练
from ultralytics import YOLO
model = YOLO('yolov8n.pt')
model.train(data = 'classdata.yaml', epochs = 35, name = 'class')
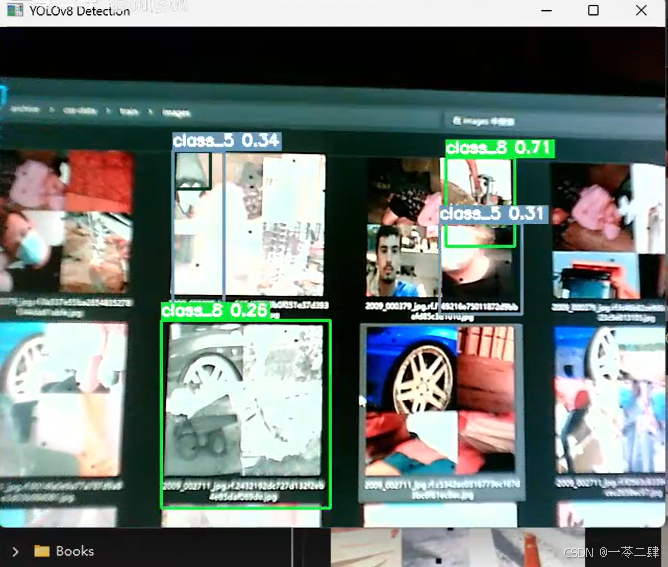
model.val()2.yolov8使用
from ultralytics import YOLO
import cv2
import random

# 加载 YOLOv8 训练模型
model = YOLO(r"D:\AI\YOLOV8\train_test\runs\detect\v8safehat4\weights\best.pt")  # 替换为你的 .pt 文件路径

# 生成类别颜色
num_classes = len(model.names)
colors = {i: (random.randint(0, 255), random.randint(0, 255), random.randint(0, 255)) for i in range(num_classes)}

# 打开摄像头(或者使用视频文件)
cap = cv2.VideoCapture(1)  # 0 表示默认摄像头,可替换为视频路径 "video.mp4"

while cap.isOpened():
    ret, frame = cap.read()
    if not ret:
        break

    # 进行目标检测
    results = model(frame)

    # 解析检测结果
    for result in results:
        for box in result.boxes:
            x1, y1, x2, y2 = map(int, box.xyxy[0])  # 获取检测框坐标
            conf = box.conf[0].item()  # 置信度
            cls = int(box.cls[0].item())  # 类别索引
            label = f"{model.names[cls]} {conf:.2f}"  # 类别名称和置信度
            color = colors.get(cls, (0, 255, 0))  # 获取该类别的颜色

            # 画检测框
            cv2.rectangle(frame, (x1, y1), (x2, y2), color, 2)

            # 计算文本尺寸
            (tw, th), _ = cv2.getTextSize(label, cv2.FONT_HERSHEY_SIMPLEX, 0.5, 2)

            # 画填充背景
            cv2.rectangle(frame, (x1, y1 - th - 5), (x1 + tw, y1), color, -1)

            # 绘制文本
            cv2.putText(frame, label, (x1, y1 - 5), cv2.FONT_HERSHEY_SIMPLEX, 0.5, (255, 255, 255), 2)

    # 显示结果
    cv2.imshow("YOLOv8 Detection", frame)

    # 按 'q' 退出
    if cv2.waitKey(1) & 0xFF == ord('q'):
        break

cap.release()
cv2.destroyAllWindows()
三,附录
数据集来源网站:Find Open Datasets and Machine Learning Projects | Kaggle
云服务器训练:https://www.matpool.com
https://featurize.cn/vm/available
模型可视化工具:https://netron.app/


 470
470

 被折叠的 条评论
为什么被折叠?
被折叠的 条评论
为什么被折叠?
 到【灌水乐园】发言


