QT Data Visualization模块(一)

本文介绍了如何在Qt框架中使用Q3DBars、Q3DScatter和Q3DSurface等类进行数据可视化,以及QAbstract3DGraph作为基础类的作用。特别提到QHeightMapSurfaceDataProxy用于处理和展示地图高程数据,以创建地形可视化效果。

摘要生成于 C知道 ,由 DeepSeek-R1 满血版支持, 前往体验 >

1、.pro文件添加模块:QT+=datavisualization

2、包含头文件:#include <QtDataVisualization>

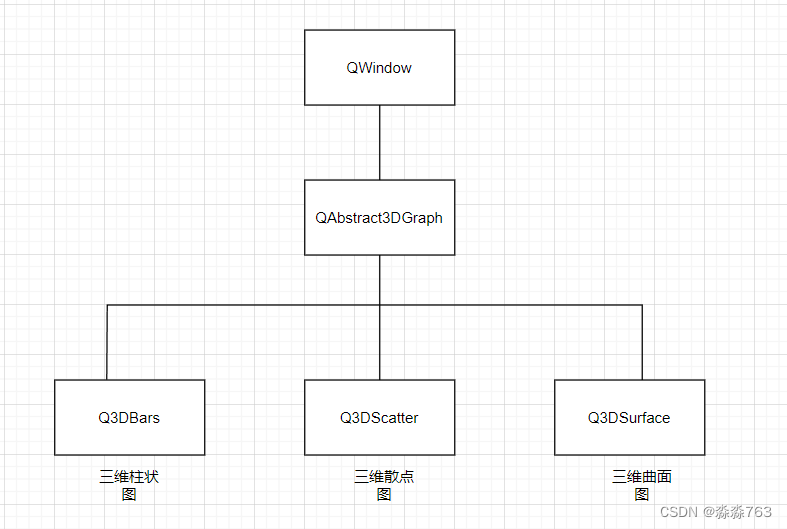
3、Q3DBars、Q3DScatter、Q3DSurface继承QWindow类。QAbstract3DGraph 是 Qt 框架中用于实现三维图形的抽象基类,QAbstract3DGraph 提供了一组通用的方法和属性。

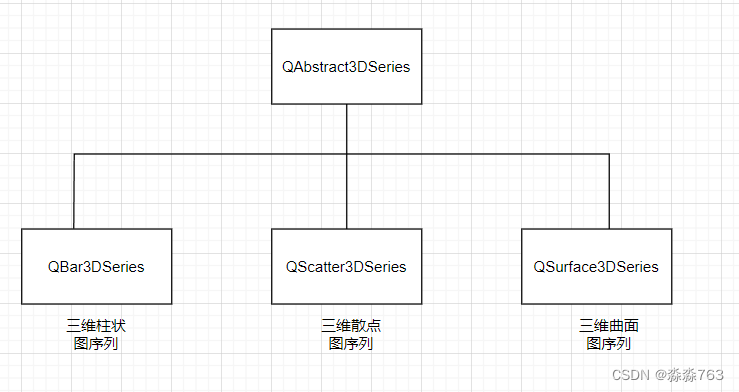
4、每一种三维图形类对应一种三维序列(在图像处理和计算机图形学中,"图形序列"是指一系列的图像帧,这些帧按照特定的顺序排列,以形成动画或视频。每个图像帧包含了在一定时间间隔内捕捉到的静态图像。将这些帧在快速的连续播放下,可以创建出平滑的动画效果)

5、数据代理(data proxy)类:与序列对应并用于存储序列数据的类。

     每一种序列都对应一种数据代理类。

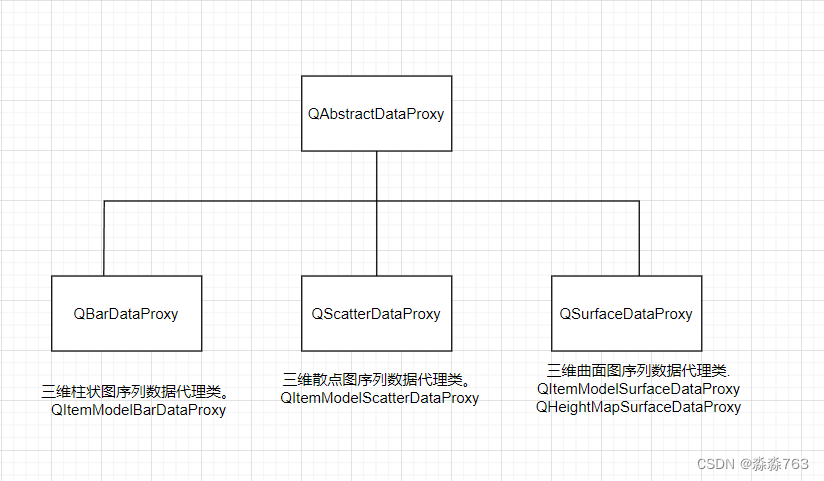
对于三维曲面序列QSurface3DSeries还有一个专门用于显示地图高程数据的数据代理类QHeightMapSurfaceDataProxy:QHeightMapSurfaceDataProxy是Qt Charts模块中的一个专门用于显示地图高程数据的数据代理类。它是QSurfaceDataProxy的子类,用于处理高程数据并将其转换为适合在QSurface3DSeries(三维曲面序列)中显示的格式。地图高程数据通常以二维矩阵的形式表示,其中每个矩阵元素对应于地图上的一个点,并具有特定的高程值。QHeightMapSurfaceDataProxy接收这样的高程数据,并将其转换为适合在QSurface3DSeries中显示的表面数据。使用QHeightMapSurfaceDataProxy,可以设置高程数据的范围、颜色映射和其他属性。可以通过设置坐标轴范围、标签和标题来自定义地图的外观。通过与QSurface3DSeries结合使用,可以将QHeightMapSurfaceDataProxy的高程数据应用于三维曲面序列中,以可视化地呈现地图的高程信息。这使得开发者可以轻松创建具有地形特征的地图可视化效果,例如山脉、山谷、海拔等。

地图高程数据指的是地球表面上各个点的高程或海拔信息。它描述了地球表面的相对高度或海拔变化,使我们能够了解地球上不同地区的地形特征。地图高程数据通常以数字的形式表示,可以用于创建地形图、海拔图和其他地形可视化效果。这些数据可以表示为二维栅格(网格)或三维模型。在二维栅格中,每个栅格单元格代表地球表面上的一个点,并包含该点的高程值。而在三维模型中,地球表面被分割成许多三角形,每个三角形顶点包含了高程信息。


--------------------------- Qt Data Visualization 5.7.0 --------------------------- Qt Data Visualization module provides multiple graph types to visualize data in 3D space both with C++ and Qt Quick 2. System Requirements =================== - Qt 5.2.1 or newer - OpenGL 2.1 or newer (recommended) or OpenGL ES2 (reduced feature set) - Manipulating Qt Data Visualization graphs with QML Designer requires Qt Creator 3.3 or newer Building ======== Configure the project with qmake: qmake After running qmake, build the project with make: (Linux) make (Windows with MinGw) mingw32-make (Windows with Visual Studio) nmake (OS X) make The above generates the default makefiles for your configuration, which is typically the release build if you are using precompiled binary Qt distribution. To build both debug and release, or one specifically, use one of the following qmake lines instead. For debug builds: qmake CONFIG+=debug make or qmake CONFIG+=debug_and_release make debug For release builds: qmake CONFIG+=release make or qmake CONFIG+=debug_and_release make release For both builds (Windows/OS X only): qmake CONFIG+="debug_and_release build_all" make After building, install the module to your Qt directory: make install If you want to uninstall the module: make uninstall Building as a statically linked library ======================================= The same as above applies, you will just have to add static to the CONFIG: qmake CONFIG+=static Documentation ============= The documentation can be generated with: make docs The documentation is generated into the doc folder under the build folder. Both Qt Assistant (qtdatavisualization.qch) and in HTML format (qtdatavisualization subfolder) documentation is generated. Please refer to the generated documentation for more information: doc/qtdatavisualization/qtdatavisualization-index.html Known Issues ============ - Some platforms like Android and WinRT cannot handle multiple native windows properly, so only the Qt Quick 2 versions of graphs are available in practice for those platforms. - Shadows are not supported with OpenGL ES2 (including Angle builds in Windows). - Anti-aliasing doesn&#39;t work with OpenGL ES2 (including Angle builds in Windows). - QCustom3DVolume items are not supported with OpenGL ES2 (including Angle builds in Windows). - Surfaces with non-straight rows and columns do not always render properly. - Q3DLight class (and Light3D QML item) are currently not usable for anything. - Changing most of Q3DScene properties affecting subviewports currently has no effect. - Widget based examples layout incorrectly in iOS. - Reparenting a graph to an item in another QQuickWindow is not supported. - Android builds of QML applications importing QtDataVisualization also require "QT += datavisualization" in the pro file. This is because Qt Data Visualization QML plugin has a dependency to Qt Data Visualization C++ library, which Qt Creator doesn&#39;t automatically add to the deployment package. - Only OpenGL ES2 emulation is available for software renderer (that is, when using QCoreApplication::setAttribute(Qt::AA_UseSoftwareOpenGL))
评论 1
添加红包

请填写红包祝福语或标题

红包个数最小为10个

红包金额最低5元

当前余额3.43前往充值 >
需支付:10.00
成就一亿技术人!
领取后你会自动成为博主和红包主的粉丝 规则
hope_wisdom
发出的红包
实付
使用余额支付
点击重新获取
扫码支付
钱包余额 0

抵扣说明:

1.余额是钱包充值的虚拟货币,按照1:1的比例进行支付金额的抵扣。
2.余额无法直接购买下载,可以购买VIP、付费专栏及课程。

余额充值