文章目录
摘要
本周围绕无监督异常检测、遗传算法及CNN文本情感分类三种算法。在异常检测讲了基于高斯分布的无监督算法原理,包括单变量与多变量高斯模型的数学基础、实现逻辑,并通过网站流量模拟数据完成算法对异常事件的识别能力;在智能优化方面,介绍了遗传算法的核心思想与流程,以家庭温控系统为例,构建包含空调温度调节与窗户开启时长优化的数学模型;在CNN,基于双向 LSTM 的 IMDb 影评情感分类模型训练流程设计。
abstract
This week focused on three algorithms: unsupervised anomaly detection, genetic algorithms, and CNN-based text sentiment classification. For anomaly detection, the principles of unsupervised algorithms based on Gaussian distribution were explained, including the mathematical foundations and implementation logic of univariate and multivariate Gaussian models, and the algorithm’s ability to identify anomalies was demonstrated using simulated website traffic data. In terms of intelligent optimization, the core ideas and processes of genetic algorithms were introduced, with a home temperature control system used as an example to build a mathematical model that optimizes both air conditioning temperature adjustments and window opening durations. For CNN, the design of the training process for an IMDb movie review sentiment classification model based on bidirectional LSTM was discussed.
一、无监督学习算法——异常检测算法
1.1 发现异常事件
正常情况下,正常的数据点都聚集在一个“正常”的范围内,而异常点则远离这个范围。从数据中识别出与预期模式显著不同的观测值、模式或事件的过程。这些异常点通常被称为"离群点"、“异常值"或"罕见事件”。
特征:稀有性:异常事件在数据中出现的频率很低;差异性:与正常模式有显著统计差异;价值性:往往蕴含着重要信息或风险信号。
技术分类:基于统计的方法(假设正常数据遵循某种统计分布,偏离该分布的数据即为异常);基于距离的方法(异常点与大多数其他点之间的距离较远);基于密度的方法(异常点位于低密度区域);基于机器学习的方法。
1.2 异常检测——基于统计的方法(高斯(正态)分布)
高斯分布(正态分布)在统计学中具有中心地位,成为异常检测的自然选择:中心极限定理支持许多自然现象近似服从正态分布;数学性质优良,便于计算和分析;参数估计简单,只需均值和方差。
单变量:
假设有一个包含 m 个正常样本的数据集:{x(1), x(2), …, x(m)}。假设这些数据来自于一个高斯分布。
当我们有一个新的数据点 x_test 时,均值、方差。我们计算它属于这个高斯分布的概率。高斯分布的概率密度函数为:p(x) = (1 / (√(2π)σ)) * exp(-(x-μ)² / (2σ²)) 。这个 p(x) 值表示数据点 x 出现的可能性。需要一个阈值 ε。如果 p(x_test) < ε,我们就认为这个点是异常的。
多变量:
假设有 n个特征。数据集是一个 m x n 的矩阵。均值向量 (μ):一个 n 维向量,每个元素是对应特征的均值。协方差矩阵 (Σ):一个 n x n 的矩阵,描述不同特征之间的相互关系。
多元高斯分布的概率密度函数为:
p(x) = (1 / ((2π)^(n/2) |Σ|^(1/2))) * exp(-1/2 (x-μ)ᵀ Σ⁻¹ (x-μ))
公式计算的是点 x 在整个多维空间中的概率密度。如果 p(x_test) < ε,则判定为异常。
生成一个代码:
类:GaussianAnomalyDetector:单变量高斯分布异常检测器
功能:拟合数据分布、计算概率密度、阈值优化、异常预测
方法:fit()(拟合均值 / 方差)、probability()(计算概率)、set_threshold()(优化阈值)、predict()(异常判断)
类:MultivariateGaussianAnomalyDetector:多元高斯分布异常检测器
功能:支持多特征联合分布,使用协方差矩阵建模
改进:处理协方差矩阵不可逆问题(添加小扰动)
import numpy as np
import pandas as pd
import matplotlib.pyplot as plt
from scipy import stats
from scipy.stats import multivariate_normal
import matplotlib

# 设置中文字体
plt.rcParams['font.sans-serif'] = ['SimHei']  # 用来正常显示中文标签
plt.rcParams['axes.unicode_minus'] = False  # 用来正常显示负号


class GaussianAnomalyDetector:
    """基于高斯分布的异常检测器"""

    def __init__(self):
        self.mu = None
        self.sigma2 = None
        self.epsilon = None

    def fit(self, X_train):
        """用训练数据拟合高斯分布"""
        self.mu = np.mean(X_train, axis=0)
        self.sigma2 = np.var(X_train, axis=0)
        return self

    def probability(self, X):
        """计算数据的概率密度"""
        # 防止除零错误
        sigma2_safe = np.where(self.sigma2 == 0, 1e-8, self.sigma2)

        # 计算每个特征的概率
        p = (1 / np.sqrt(2 * np.pi * sigma2_safe)) * \
            np.exp(-0.5 * (X - self.mu) ** 2 / sigma2_safe)

        # 返回联合概率(假设特征独立)
        return np.prod(p, axis=1)

    def calculate_f1(self, y_true, y_pred):
        """计算F1分数"""
        tp = np.sum(y_true & y_pred)
        fp = np.sum(~y_true & y_pred)
        fn = np.sum(y_true & ~y_pred)

        precision = tp / (tp + fp) if (tp + fp) > 0 else 0
        recall = tp / (tp + fn) if (tp + fn) > 0 else 0
        f1 = 2 * precision * recall / (precision + recall) if (precision + recall) > 0 else 0

        return f1

    def set_threshold(self, X_val, y_val):
        """用验证集寻找最佳阈值"""
        probabilities = self.probability(X_val)

        best_epsilon = 0
        best_f1 = 0

        # 在可能的阈值范围内搜索
        for epsilon in np.linspace(probabilities.min(),
                                   probabilities.max(), 1000):
            predictions = probabilities < epsilon
            f1 = self.calculate_f1(y_val, predictions)

            if f1 > best_f1:
                best_f1 = f1
                best_epsilon = epsilon

        self.epsilon = best_epsilon
        return best_epsilon

    def predict(self, X):
        """预测是否为异常"""
        probabilities = self.probability(X)
        return probabilities < self.epsilon


class MultivariateGaussianAnomalyDetector:
    """基于多元高斯分布的异常检测器"""

    def __init__(self):
        self.mu = None
        self.cov = None
        self.epsilon = None

    def fit(self, X_train):
        """拟合多元高斯分布"""
        self.mu = np.mean(X_train, axis=0)
        self.cov = np.cov(X_train.T)

        # 处理协方差矩阵不可逆的情况
        if np.linalg.det(self.cov) == 0:
            self.cov += np.eye(self.cov.shape[0]) * 1e-8

        return self

    def probability(self, X):
        """计算多元高斯概率密度"""
        return multivariate_normal(self.mu, self.cov).pdf(X)

    def predict(self, X, epsilon=None):
        """预测异常"""
        if epsilon is None:
            epsilon = self.epsilon

        probabilities = self.probability(X)
        return probabilities < epsilon


# 工具函数
def check_normality(data):
    """检查数据是否符合正态分布"""
    statistic, p_value = stats.normaltest(data)
    return p_value > 0.05  # 如果p值>0.05,认为符合正态分布


def transform_data(data):
    """将数据转换为更接近正态分布"""
    # 尝试对数转换
    transformed = np.log1p(data)  # log(1+x)
    return transformed


def generate_web_traffic_data(days=30):
    """生成模拟的网站流量数据"""
    np.random.seed(42)

    # 正常流量:白天高,晚上低
    hours = np.arange(24 * days)
    normal_traffic = 1000 + 500 * np.sin(2 * np.pi * hours / 24) + np.random.normal(0, 100, len(hours))

    # 添加一些异常点
    anomalies_indices = [100, 200, 300, 450, 600]
    normal_traffic[anomalies_indices] = [5000, 50, 4000, 100, 3500]  # 异常值

    df = pd.DataFrame({
        'timestamp': pd.date_range(start='2024-01-01', periods=len(hours), freq='h'),  # 改为小写 'h'
        'traffic': normal_traffic,
        'is_anomaly': False
    })
    df.loc[anomalies_indices, 'is_anomaly'] = True

    return df


def plot_results(data, true_anomalies, detected_anomalies, probabilities, detector):
    """可视化检测结果"""
    plt.figure(figsize=(14, 8))

    # 绘制流量数据
    plt.subplot(2, 1, 1)
    plt.plot(data['timestamp'], data['traffic'], label='Traffic', alpha=0.7)
    plt.scatter(data[true_anomalies]['timestamp'],
                data[true_anomalies]['traffic'],
                color='red', label='True Anomalies', s=50)
    plt.scatter(data[detected_anomalies]['timestamp'],
                data[detected_anomalies]['traffic'],
                color='orange', label='Detected Anomalies', marker='x', s=100)
    plt.title('Anomaly Detection Results')
    plt.legend()

    # 绘制概率分布
    plt.subplot(2, 1, 2)
    train_mask = ~data['is_anomaly']
    plt.hist(probabilities[train_mask], bins=50, alpha=0.7, label='Normal Data Probability')
    plt.hist(probabilities[true_anomalies], bins=50, alpha=0.7, label='Anomaly Data Probability', color='red')
    plt.axvline(detector.epsilon, color='black', linestyle='--', label=f'Threshold: {detector.epsilon:.6f}')
    plt.xlabel('Probability Density')
    plt.ylabel('Frequency')
    plt.legend()

    plt.tight_layout()
    plt.show()


def evaluate_performance(true_labels, predicted_labels):
    """评估模型性能"""
    tp = np.sum(true_labels & predicted_labels)
    fp = np.sum(~true_labels & predicted_labels)
    fn = np.sum(true_labels & ~predicted_labels)
    tn = np.sum(~true_labels & ~predicted_labels)

    accuracy = (tp + tn) / len(true_labels)
    precision = tp / (tp + fp) if (tp + fp) > 0 else 0
    recall = tp / (tp + fn) if (tp + fn) > 0 else 0
    f1 = 2 * precision * recall / (precision + recall) if (precision + recall) > 0 else 0

    print("=== Performance Evaluation ===")
    print(f"True Positives (TP): {tp}")
    print(f"False Positives (FP): {fp}")
    print(f"True Negatives (TN): {tn}")
    print(f"False Negatives (FN): {fn}")
    print(f"Accuracy: {accuracy:.4f}")
    print(f"Precision: {precision:.4f}")
    print(f"Recall: {recall:.4f}")
    print(f"F1-Score: {f1:.4f}")

    return {
        'accuracy': accuracy,
        'precision': precision,
        'recall': recall,
        'f1': f1
    }


# 主程序
if __name__ == "__main__":
    # 1. 生成示例数据
    print("Generating web traffic data...")
    data = generate_web_traffic_data()

    # 2. 可视化原始数据
    plt.figure(figsize=(12, 6))
    plt.plot(data['timestamp'], data['traffic'], label='Traffic')
    plt.scatter(data[data['is_anomaly']]['timestamp'],
                data[data['is_anomaly']]['traffic'],
                color='red', label='True Anomalies')
    plt.title('Web Traffic Data')
    plt.legend()
    plt.show()

    # 3. 准备数据
    X = data[['traffic']].values

    # 检查数据分布
    if not check_normality(X.flatten()):
        print("Data does not follow normal distribution, applying transformation...")
        X = transform_data(X)
        data['traffic'] = X.flatten()
    else:
        print("Data follows normal distribution, no transformation needed.")

    # 4. 划分训练集和测试集
    train_mask = ~data['is_anomaly']  # 用正常数据训练
    X_train = X[train_mask]

    # 5. 训练模型
    print("Training Gaussian anomaly detection model...")
    detector = GaussianAnomalyDetector()
    detector.fit(X_train)

    # 6. 在整个数据集上检测异常
    probabilities = detector.probability(X)

    # 7. 设置阈值(使用训练数据的5%分位数)
    detector.epsilon = np.percentile(probabilities[train_mask], 5)
    print(f"Automatically set anomaly threshold: {detector.epsilon:.6f}")

    # 8. 预测异常
    predictions = detector.predict(X)

    # 9. 评估结果
    true_anomalies = data['is_anomaly'].values
    detected_anomalies = predictions

    print(f"Detected anomalies: {np.sum(detected_anomalies)}")
    print(f"True anomalies: {np.sum(true_anomalies)}")
    print(f"Correctly detected anomalies: {np.sum(detected_anomalies & true_anomalies)}")

    # 性能评估
    performance = evaluate_performance(true_anomalies, detected_anomalies)

    # 10. 可视化结果
    plot_results(data, true_anomalies, detected_anomalies, probabilities, detector)

    # 多变量示例(可选)
    print("\nMultivariate anomaly detection example:")
    print("To use multivariate detection, prepare data with multiple features:")
    print("# X_multi = data[['traffic', 'other_feature1', 'other_feature2']].values")
    print("# multi_detector = MultivariateGaussianAnomalyDetector()")
    print("# multi_detector.fit(X_multi[train_mask])")
    print("# multi_anomalies = multi_detector.predict(X_multi)")

    # 分析误报
    false_positives = detected_anomalies & ~true_anomalies
    if np.sum(false_positives) > 0:
        print(f"\nFalse positives analysis:")
        print(f"Number of false positives: {np.sum(false_positives)}")
        print("Consider adjusting the threshold or using more features to reduce false positives.")
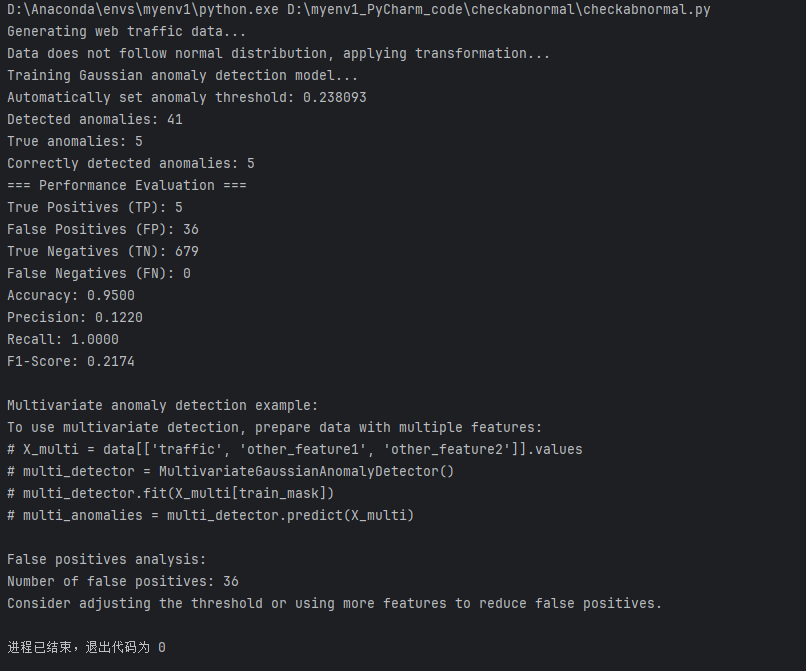
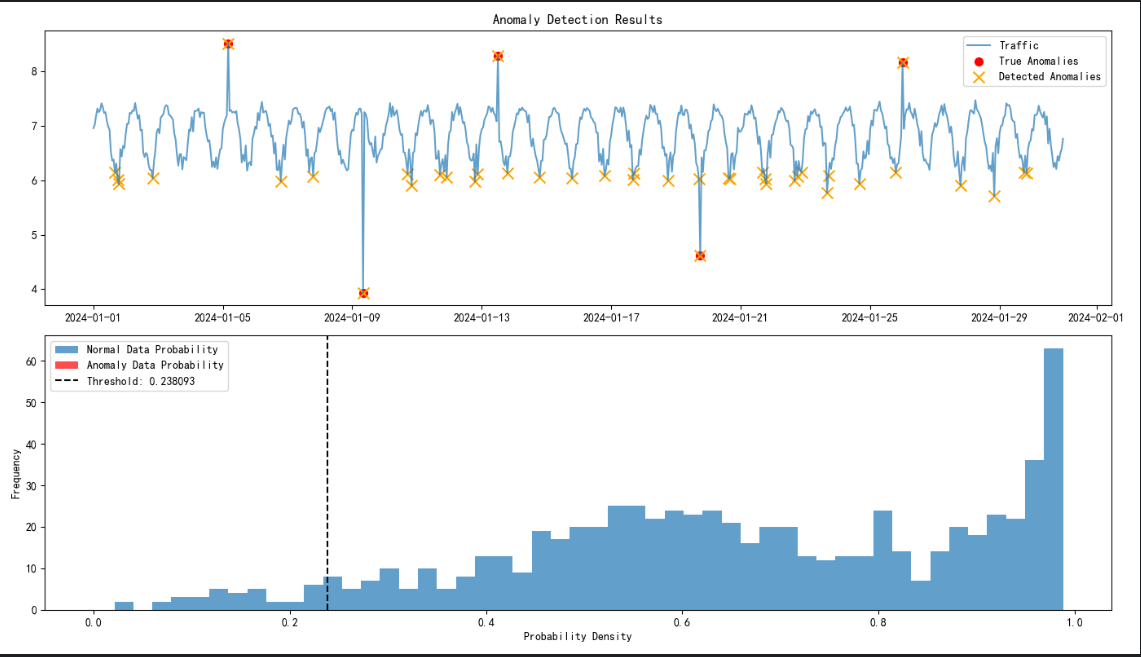
结果:


二、GA遗传算法
2.1 介绍
遗传算法是一种模仿自然界生物进化过程(达尔文的“物竞天择,适者生存”原理)的元启发式算法,用于解决优化和搜索问题。它属于进化计算的一个分支。
其核心思想是:一个问题的潜在解(比如一个函数的最大值点)被看作是一个“个体”,而一群个体构成“种群”。通过模拟生物的选择、交叉(杂交)、变异等过程,让种群不断“进化”,从而产生出越来越好的近似解。
流程:
1)初始化:随机生成一个由 N 个个体组成的初始种群。每个个体代表问题的一个潜在解。
2)评估适应度:通过适应度函数计算每个个体的适应度。适应度函数需与问题目标一致(求最小值时,适应度可设为1/f(x))。
3)选择操作:根据适应度选择“优秀个体”进入下一代。(轮盘赌选择、锦标赛选择…)
4)交叉操作:模拟生物“有性生殖”,将两个个体的染色体片段交换,生成新个体。
5)变异操作:以低概率随机改变个体的染色体片段,增加种群多样性(避免陷入局部最优)。
6)迭代进化:重复“评估-选择-交叉-变异”步骤,直到满足终止条件(如达到最大迭代次数、适应度收敛)。
注:在这个过程中,数据的初始和交叉,变异都有可能影响”下降“流程。
遗传算法适用于复杂、非线性、多约束的优化问题。
1)组合优化:如旅行商问题(TSP,寻找访问多个城市的最短路径)、背包问题(选择物品使价值最大且重量不超限)。
2)函数优化:求解复杂函数的最小值/最大值。
3)机器学习:用于特征选择(筛选对模型最有用的特征)、神经网络架构设计(优化神经网络的层数、神经元数量)。
4)工程优化:如机械设计(优化零件的尺寸使强度最大)、电路布局(优化元件位置使信号延迟最小)。
5)智能控制:如家庭温控系统(优化空调温度与窗户开启时间,使能耗最低且温度舒适)、高速货运动车组智能配载(优化货物分布使车辆负载均衡)。
2.2 智能控制例子
1.问题定义
问题:家庭通过空调和窗户通风调节室温,目标是最小化全天的能源消耗成本,同时保证室内温度始终处于舒适区间(22°C~26°C)。
目标:最小化总能耗成本 = 空调耗电量 × 电价 + 开窗换气的潜在热量损失(间接成本)。
约束条件:
1)室温约束:22°C≤T(t)≤26°C(每小时检测一次);
2)设备操作限制:空调开关机次数 ≤4次/天,窗户开合时间 ≤6小时/天;
3)初始状态:早晨6点室温为20°C,傍晚18点后禁止开窗(避免噪音)。
(注:可以在极端天气下进行实验,如当地天气极冷和极热条件下测试散热和散冷,如果在条件下满足,则其他天气能满足。)
2.编码
空调温度设定值(如18°C30°C)和窗户开启时长(06小时)均为连续变量,直接采用实数向量编码:染色体结构:[空调目标温度,窗户开启时长],长度为2.
3.适应度函数
目标:平衡能耗成本与舒适度,违反约束时施加惩罚。
F(x)=Cost(x)+P(x)
成本函数:
Cost=
:空调实时功率(与设定温度和环境温差相关);
:温度偏离舒适的惩罚系数.
约束惩罚:
P(x)=M, T(t)<22°C或T(t)>26°C或空调开关机超限或窗户开合超时.
M为极大惩罚值。
4.算子选择
交叉算子:模拟二进制交叉(SBX)
对两个父代的实数向量进行交叉,生成子代时保留解的连续性。
SBX适合连续变量的全局搜索,能混合父代策略。
变异算子:高斯变异
对每个基因添加高斯噪声(均值0,方差随迭代衰减)。温度设定值变异:,截断 [18, 30]。窗户时长变异:。
高斯变异在后期缩小搜索范围,提升收敛精度。
两个核心变量(空调温度+窗户时长)。

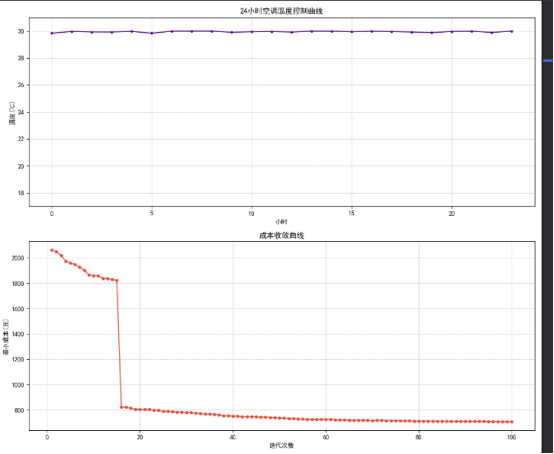
代码:
import numpy as np
import random
from deap import base, creator, tools, algorithms
import matplotlib.pyplot as plt

# 中文显示问题
plt.rcParams['font.sans-serif'] = ['SimHei']
plt.rcParams['axes.unicode_minus'] = False

# ===================== 参数设置 =====================
POP_SIZE = 100  # 种群大小
MAX_GEN = 100  # 最大迭代次数
CXPB = 0.8  # 交叉概率
MUTPB = 0.2  # 变异概率
NGENS = 24  # 模拟24小时(时间步长1小时)
INIT_TEMP = 20.0  # 初始温度(℃)
OUT_TEMP = 30.0  # 外界温度(℃)
ELEC_PRICE = 0.6  # 电价(元/kWh)
LAMBDA = 10  # 温度偏离惩罚系数

# ===================== 设备参数 =====================
AC_POWER_BASE = 1.5  # 空调基础功率(kW)(温差10℃时满功率)
WIN_EFFICIENCY = 0.8  # 窗户开启时的隔热效率(0~1,1为完全隔热)

# ===================== 染色体定义 =====================
# 染色体结构:24小时空调温度 + 1个窗户开启时长(小时)
AC_TEMP_MIN = 18.0
AC_TEMP_MAX = 30.0
WIN_TIME_MIN = 0.0
WIN_TIME_MAX = 6.0


# ===================== 函数定义 =====================
def init_individual(icls):
    """初始化个体:24小时空调温度 + 窗户开启时长"""
    ac_temps = [random.uniform(AC_TEMP_MIN, AC_TEMP_MAX) for _ in range(NGENS)]
    win_time = random.uniform(WIN_TIME_MIN, WIN_TIME_MAX)
    return icls(ac_temps + [win_time])


def simulate_temperature(ac_temp, win_eff, current_temp):
    """模拟1小时后室内温度变化"""
    k = 0.15  # 热传导系数(W/m²·℃)
    h = 0.05  # 对流系数(W/m²·℃)
    delta_T = (-k * (current_temp - ac_temp)
               - h * win_eff * (current_temp - OUT_TEMP))
    return current_temp + delta_T


def calc_fitness(ind):
    """计算综合成本:能耗 + 舒适度惩罚 + 切换惩罚"""
    total_cost = 0.0
    current_temp = INIT_TEMP
    ac_switches = 0
    ac_temps, win_time = ind[:NGENS], ind[NGENS]

    for t in range(NGENS):
        # 计算窗户效率
        hour_start, hour_end = t, t + 1
        win_total = win_time
        on_start = max(hour_start, 0.0)
        on_end = min(hour_end, win_total)
        window_on = max(0.0, on_end - on_start)
        win_eff = 1.0 - window_on * (1.0 - WIN_EFFICIENCY)

        # 温度模拟
        ac_temp = ac_temps[t]
        next_temp = simulate_temperature(ac_temp, win_eff, current_temp)

        # 能耗成本
        ac_power = AC_POWER_BASE * abs(ac_temp - current_temp) / 10.0
        total_cost += ac_power * ELEC_PRICE

        # 舒适度惩罚
        if not (22 <= next_temp <= 26):
            penalty = LAMBDA * (abs(next_temp - 24) ** 1.5)
            total_cost += penalty

        # 切换惩罚
        if t > 0 and abs(ac_temps[t] - ac_temps[t - 1]) > 2:
            ac_switches += 1
    if ac_switches > 4:
        total_cost += 1000

    return (total_cost,)


# ===================== DEAP 框架初始化 =====================
creator.create("FitnessMin", base.Fitness, weights=(-1.0,))
creator.create("Individual", list, fitness=creator.FitnessMin)

toolbox = base.Toolbox()
toolbox.register("individual", init_individual, creator.Individual)
toolbox.register("population", tools.initRepeat, list, toolbox.individual)

# 注册遗传操作
toolbox.register("mate", tools.cxSimulatedBinaryBounded, eta=20,
                 low=[AC_TEMP_MIN] * NGENS + [WIN_TIME_MIN],
                 up=[AC_TEMP_MAX] * NGENS + [WIN_TIME_MAX])
toolbox.register("mutate", tools.mutPolynomialBounded, eta=20,
                 low=[AC_TEMP_MIN] * NGENS + [WIN_TIME_MIN],
                 up=[AC_TEMP_MAX] * NGENS + [WIN_TIME_MAX], indpb=0.15)
toolbox.register("select", tools.selTournament, tournsize=3)
toolbox.register("evaluate", calc_fitness)


# 遗传算法主流程
def main():
    pop = toolbox.population(n=POP_SIZE)
    hof = tools.ParetoFront()
    stats = tools.Statistics(lambda ind: ind.fitness.values)
    stats.register("min", np.min)
    stats.register("avg", np.mean)

    # 运行算法
    pop, log = algorithms.eaMuPlusLambda(
        pop, toolbox,
        mu=POP_SIZE, lambda_=POP_SIZE,
        cxpb=CXPB, mutpb=MUTPB,
        ngen=MAX_GEN,
        stats=stats, halloffame=hof,
        verbose=True
    )
    return hof[0], log


#可视化
if __name__ == "__main__":
    best_ind, log = main()

    # 输出最优解
    print("=" * 30 + " 优化结果 " + "=" * 30)
    print(f"最优空调温度序列: {[round(t, 1) for t in best_ind[:NGENS]]}")
    print(f"最优窗户开启时长: {best_ind[NGENS]:.1f} 小时")
    print(f"最低综合成本: {best_ind.fitness.values[0]:.2f} 元")

    # 绘制温度变化曲线
    fig, (ax1, ax2) = plt.subplots(2, 1, figsize=(12, 10))

    # 温度曲线
    ax1.plot(best_ind[:NGENS], label="空调温度", color='#4B0082', marker='o', markersize=3)
    ax1.set_ylim(AC_TEMP_MIN - 1, AC_TEMP_MAX + 1)
    ax1.set_title("24小时空调温度控制曲线")
    ax1.grid(True, linestyle='--', alpha=0.7)
    ax1.set_xlabel("小时")
    ax1.set_ylabel("温度(℃)")

    # 成本收敛曲线(修正数据维度)
    min_costs = log.select("min")[1:]  # 去除初始代数据
    x_values = range(1, MAX_GEN + 1)
    assert len(x_values) == len(min_costs), "数据维度不匹配"

    ax2.plot(x_values, min_costs, 'o-', color='#E74C3C', markersize=4)
    ax2.set_title("成本收敛曲线")
    ax2.set_xlabel("迭代次数")
    ax2.set_ylabel("最小成本(元)")
    ax2.grid(True, linestyle='--', alpha=0.7)

    plt.tight_layout()
    plt.show()
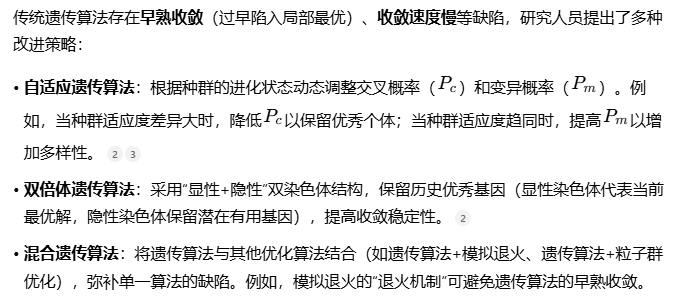
一些改进的算法。

三、IMDb
使用Hugging Face的torchtext.datasets.IMDB,包含:
25,000条训练评论(12.5k正面,12.5k负面),25,000条测试评论(12.5k正面,12.5k负面)。
数据格式:每条数据包含text(评论内容)和label(0/1表示负面/正面)。
模型架构:双向LSTM(隐藏层维度256);Dropout正则化(0.5);线性分类头。
训练配置:Adam优化器(学习率0.001);学习率调度器(每3个epoch衰减0.1);早停机制(保存最佳模型)。
import torch
from torch import nn
from torch.utils.data import DataLoader
from torchtext.data.utils import get_tokenizer
from torchtext.vocab import build_vocab_from_iterator
from torchtext.datasets import IMDB
from tqdm import tqdm

# 参数设置
BATCH_SIZE = 64
MAX_SEQ_LEN = 500
EMBED_DIM = 128
NUM_CLASSES = 2
EPOCHS = 5


#  数据加载与预处理
def load_and_process_data():
    # 加载原始数据集
    train_data, test_data = IMDB(split=('train', 'test'))

    # 分离文本和标签
    train_texts, train_labels = [], []
    test_texts, test_labels = [], []

    for label, text in train_data:
        train_texts.append(text)
        train_labels.append(1 if label == 'pos' else 0)

    for label, text in test_data:
        test_texts.append(text)
        test_labels.append(1 if label == 'pos' else 0)

    # 构建基础分词器
    tokenizer = get_tokenizer('basic_english')

    # 构建词汇表
    vocab = build_vocab_from_iterator(map(tokenizer, train_texts),
                                      specials=['<unk>', '<pad>', '<bos>', '<eos>'],
                                      min_freq=5)
    vocab.set_default_index(vocab['<unk>'])

    # 文本转张量函数
    def text_to_tensor(text):
        tokens = tokenizer(text)
        if len(tokens) > MAX_SEQ_LEN:
            tokens = tokens[:MAX_SEQ_LEN - 1] + ['<eos>']
        else:
            tokens += ['<pad>'] * (MAX_SEQ_LEN - len(tokens))
        return torch.tensor([vocab[token]
        for token in tokens], dtype=torch.long)

    # 创建数据集
    class IMDBDataset(torch.utils.data.Dataset):
        def __init__(self, texts, labels, tokenizer):
            self.texts = texts
            self.labels = labels
            self.tokenizer = tokenizer

        def __len__(self):
            return len(self.texts)

        def __getitem__(self, idx):
            return {
                'text': text_to_tensor(self.texts[idx]),
                'label': torch.tensor(self.labels[idx], dtype=torch.long)
            }

    # 创建数据加载器
    train_dataset = IMDBDataset(train_texts, train_labels, tokenizer)
    test_dataset = IMDBDataset(test_texts, test_labels, tokenizer)

    train_loader = DataLoader(train_dataset, batch_size=BATCH_SIZE, shuffle=True)
    test_loader = DataLoader(test_dataset, batch_size=BATCH_SIZE)

    return train_loader, test_loader, vocab


#  模型定义
class TextClassifier(nn.Module):
    def __init__(self, vocab_size, embed_dim, num_classes):
        super().__init__()
        self.embedding = nn.Embedding(vocab_size, embed_dim)
        self.rnn = nn.LSTM(embed_dim, 256, bidirectional=True, batch_first=True)
        self.fc = nn.Linear(256 * 2, num_classes)
        self.dropout = nn.Dropout(0.5)

    def forward(self, x):
        x = self.embedding(x)  # [batch, seq] -> [batch, seq, embed]
        x, _ = self.rnn(x)  # [batch, seq, embed] -> [batch, seq, hidden*2]
        x = self.dropout(x[:, -1, :])  # 取最后一个时间步
        return self.fc(x)


#  训练与评估
def train_model():
    # 初始化环境
    device = torch.device('cuda' if torch.cuda.is_available() else 'cpu')
    train_loader, test_loader, vocab = load_and_process_data()

    # 初始化模型
    model = TextClassifier(len(vocab), EMBED_DIM, NUM_CLASSES).to(device)
    criterion = nn.CrossEntropyLoss()
    optimizer = torch.optim.AdamW(model.parameters(), lr=2e-5)

    # 训练循环
    for epoch in range(EPOCHS):
        model.train()
        total_loss = 0
        loop = tqdm(train_loader, desc=f'Epoch {epoch + 1}')

        for batch in loop:
            optimizer.zero_grad()
            inputs = batch['text'].to(device)
            labels = batch['label'].to(device)

            outputs = model(inputs)
            loss = criterion(outputs, labels)
            loss.backward()
            optimizer.step()

            total_loss += loss.item()
            loop.set_postfix(loss=loss.item())

    # 模型评估
    model.eval()
    correct = 0
    total = 0
    with torch.no_grad():
        for batch in test_loader:
            inputs = batch['text'].to(device)
            labels = batch['label'].to(device)
            outputs = model(inputs)
            _, predicted = torch.max(outputs.data, 1)
            total += labels.size(0)
            correct += (predicted == labels).sum().item()

    print(f'测试集准确率: {100 * correct / total:.2f}%')


# 执行训练
if __name__ == "__main__":
    train_model()
版本有点问题,没跑出来结果。
总结
本周学习的内容较少,其中无监督学习上异常检测算法简单实现,智能优化遗产算法是一个课后习题的代码实践,CNN的IMDb情感分析代码没跑起来。同时就算法而言需要把一些常用的代码、类结构总结,方便理解调用。


 1405
1405

 被折叠的 条评论
为什么被折叠?


