


主成分分析 是最常用的线性降维方法,它是通过线性投影,将高维的数据映射到低维的空间中,目的是使用较少的数据维度,保留更多原有数据特征。
import numpy as np
import matplotlib.pyplot as plt


mean = [20, 20]   #平均
cov = [[5, 5], [5, 50]] #协方差
x, y = np.random.multivariate_normal(mean, cov, 500).T

plt.plot(x, y, '.')
plt.axis([0, 40, 0, 40])
plt.xlabel('color 1')
plt.ylabel('birthday 2')

plt.show()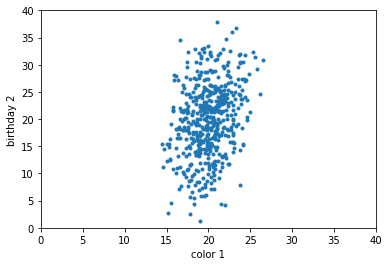
展示出两个特征向量,一个是数据分布最大方向,也称第一主成分,另一个是方差方向,第二主成分。
import numpy as np
import matplotlib.pyplot as plt
import cv2

mean = [20, 20]
cov = [[5, 5], [5, 25]]
X = np.random.multivariate_normal(mean, cov, 500)
x, y = X.T

mu, eig = cv2.PCACompute(X, np.array([]))

plt.plot(x, y, '.', zorder=1)
plt.quiver(mean[0], mean[1], eig[0, 0], eig[0, 1],zorder=3, scale=0.2, units='xy')
plt.quiver(mean[0], mean[1], eig[1, 0], eig[1, 1],zorder=3, scale=0.2, units='xy')
plt.axis([0, 40, 0, 40])
plt.xlabel('feature 1')
plt.ylabel('feature 2')
plt.show() 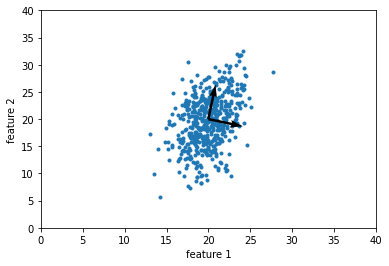
eig:特征值 mu:主要的维度


 1322
1322

 被折叠的 条评论
为什么被折叠?
被折叠的 条评论
为什么被折叠?
 到【灌水乐园】发言


