


 本文详细介绍如何使用Leaflet创建具备缩放与图层切换功能的地图,并通过leaflet.pm增强交互体验,包括绘制图形、编辑功能及事件监听。
1.安装
npm install leaflet
2.引入
import L from 'leaflet';
import 'leaflet/dist/leaflet.css';
3.初始化地图
 map = L.map("mapDiv", {
            crs: L.CRS.EPSG4326,  // 要使用的坐标参考系
            center: [29.84, 121.61],  // 地图的初始地理中心
            zoom: 12,  // 初始地图缩放级别
            layers: [imgMap],  // 最初将添加到地图的图层数组
            zoomControl: false,  // 缩放控件是否显示
            attributionControl: false,  // 右下角的leaflet标志是否显示
 });
4.设置缩放按钮和切换图层按钮
 L.control.layers(baseLayers, overlayLayers).addTo(map);
 L.control.zoom({
     zoomInTitle: '放大',
     zoomOutTitle: '缩小'
  }).addTo(map);


const normalMapm = L.tileLayer('http://t3.tianditu.com/vec_c/wmts?layer=vec&style=default&tilematrixset=c&Service=WMTS&Request=GetTile&Version=1.0.0&Format=tiles&TileMatrix={z}&TileCol={x}&TileRow={y}&tk=e2b00ec180ba4f7ff1fdb526cd082b4e', {
        maxZoom: 16,
        minZoom: 5,
        zoomOffset: 1
    })
    const normalMapa = L.tileLayer('http://t0.tianditu.gov.cn/cva_c/wmts?layer=cva&style=default&tilematrixset=c&Service=WMTS&Request=GetTile&Version=1.0.0&Format=tiles&TileMatrix={z}&TileCol={x}&TileRow={y}&tk=e2b00ec180ba4f7ff1fdb526cd082b4e', {
        maxZoom: 16,
        minZoom: 5,
        zoomOffset: 1
    })
    const imgMapm = L.tileLayer('http://t0.tianditu.gov.cn/img_c/wmts?layer=img&style=default&tilematrixset=c&Service=WMTS&Request=GetTile&Version=1.0.0&Format=tiles&TileMatrix={z}&TileCol={x}&TileRow={y}&tk=e2b00ec180ba4f7ff1fdb526cd082b4e', {
        maxZoom: 16,
        minZoom: 5,
        zoomOffset: 1
    })
    const imgMapa = L.tileLayer('http://t0.tianditu.gov.cn/cia_c/wmts?layer=cia&style=default&tilematrixset=c&Service=WMTS&Request=GetTile&Version=1.0.0&Format=tiles&TileMatrix={z}&TileCol={x}&TileRow={y}&tk=e2b00ec180ba4f7ff1fdb526cd082b4e', {
        maxZoom: 16,
        minZoom: 5,
        zoomOffset: 1
    })

    const normalMap = L.layerGroup([normalMapm, normalMapa]), imgMap = L.layerGroup([imgMapm, imgMapa]);
    const baseLayers = { "行政": normalMap, "卫星": imgMap };
    const overlayLayers = {}
5.设置定位的图片
delete L.Icon.Default.prototype._getIconUrl;
L.Icon.Default.mergeOptions({
       iconRetinaUrl: require('leaflet/dist/images/marker-icon-2x.png'),
       iconUrl: require('leaflet/dist/images/marker-icon.png'),
       shadowUrl: require('leaflet/dist/images/marker-shadow.png'),
       iconSize: [70, 70],
       shadowSize: [50, 64],
       iconAnchor: [40, 54],
       shadowAnchor: [4, 62],
       popupAnchor: [-3, -76]
});
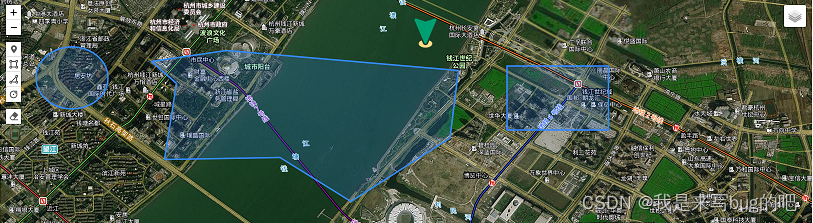
6.绘制图层
 L.marker(res).addTo(map)

 L.polygon(res, { color: 'rgb(51, 136, 255)', fillColor: 'rgb(51, 136, 255)',fillOpacity:0.2, weight: 3 }).addTo(map);

 L.polyline(res, { color: 'rgb(51, 136, 255)', fillColor: 'rgb(51, 136, 255)', fill: true }).addTo(map);

L.circle([res.lat, res.lng], { color: 'rgb(51, 136, 255)', fillColor: 'rgba(51, 136, 255,.2)', radius: res.raduis, fillOpacity: 1 }).addTo(map)

  // color:线段颜色
  // weight:线段宽度
  // opacity:线段透明度
  // dashArray:虚线间隔
  // fill:是否填充内部(true/false)
  // fillColor:内部填充颜色,如不设置,默认为color颜色
  // fillOpacity:内部填充透明度
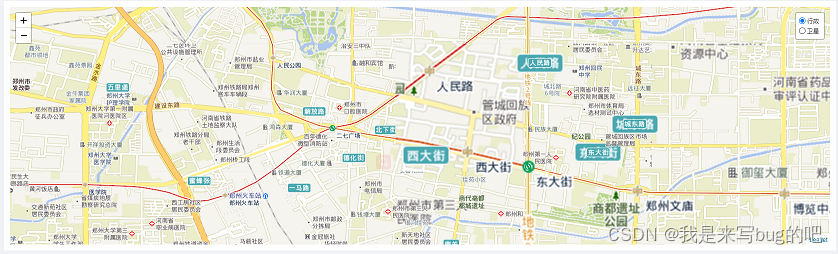
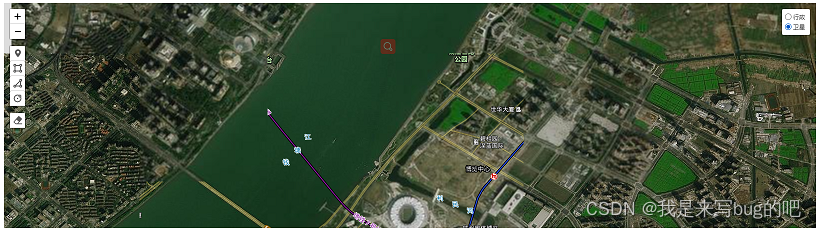
至此一个具有缩放按钮和切换地图图层的页面出来了,下面将使用leaflet.pm来为地图添加工具条控件。
1.安装
npm install leaflet.pm
2.引入
import "leaflet.pm";
import "leaflet.pm/dist/leaflet.pm.css";
3.设置中文和控件
  map.pm.setLang('zh');
  map.pm.addControls({
         position: "topleft",
         drawPolygon: true, // 绘制多边形
         drawMarker: true, //绘制标记点
         drawCircleMarker: false, //绘制圆形标记
         drawPolyline: false, //绘制线条
         drawRectangle: true,	//绘制矩形
         drawCircle: true, //绘制圆圈
         editMode: false, //编辑多边形
         dragMode: false, //拖动多边形
         cutPolygon: false, // 添加一个按钮以删除多边形里面的部分内容
         removalMode: true  // 清除多边形
  });

 // 设置绘制后的线条颜色等
 map.pm.setPathOptions({
     color: "orange",
     illColor: "green",
     fillOpacity: 0.4
  });
4.事件
 map.on("pm:drawstart", e => {
         console.log(e, "点击控件绘制时调用");
 });
 map.on("pm:drawend", e => {
         console.log(e, "禁止绘制");
 });
 map.on("pm:create", e => {
         console.log(e, "绘制完成时调用");
  });
 map.on('pm:globalremovalmodetoggled', e => {
            console.log(e, "清除图层时调用");
 })


 4090
4090

 被折叠的 条评论
为什么被折叠?
被折叠的 条评论
为什么被折叠?
 到【灌水乐园】发言


