


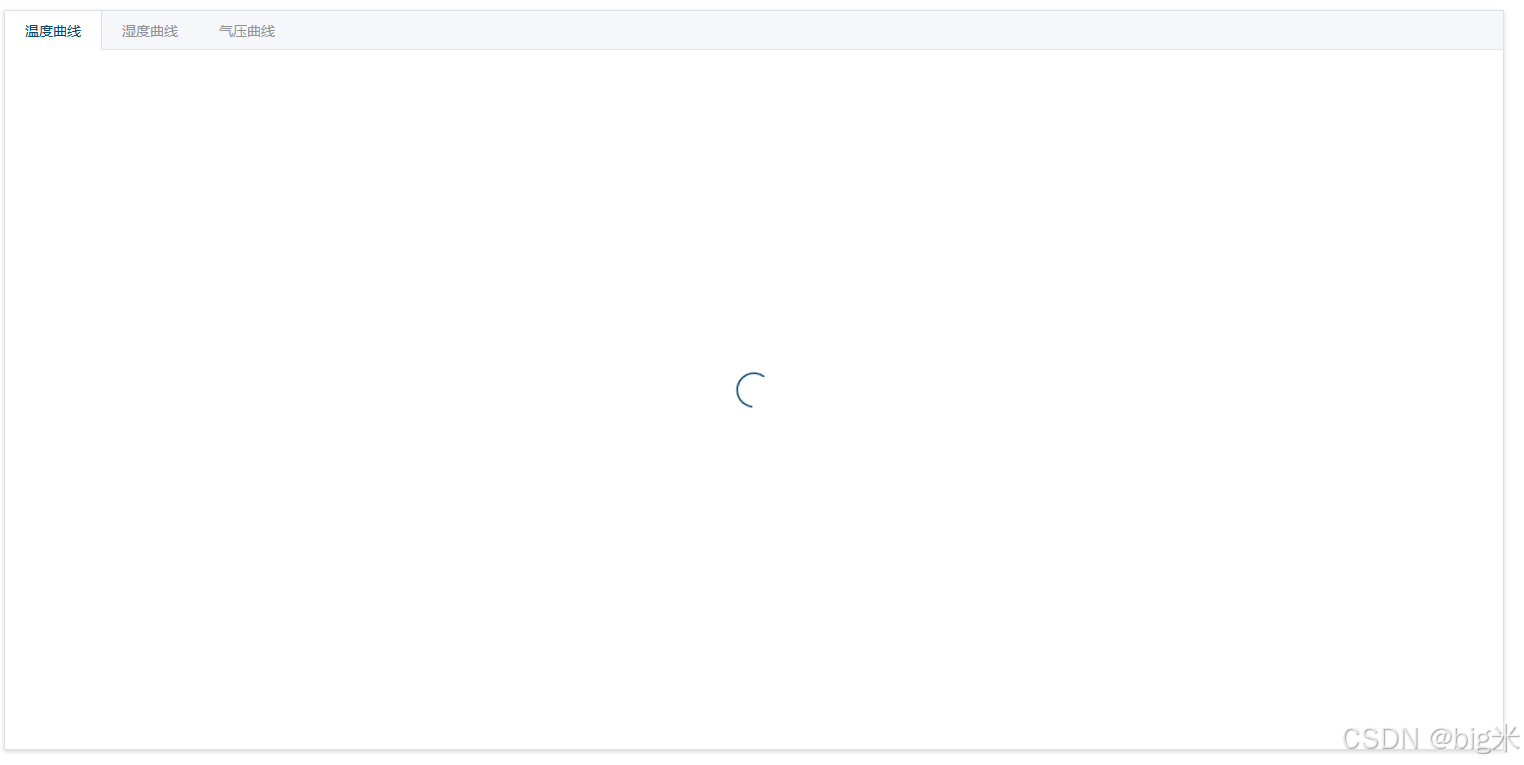
一、用el-tabs展示三个曲线,直接在el-tab-pane后加v-loading
<el-tabs type="border-card" style="width: 1500px;height: 740px;">
  <el-tab-pane label="温度曲线">
     <div v-loading="isLoading">
         <div ref="tempEchart" style="width: 1500px;height: 650px;"></div>
     </div></el-tab-pane>
  <el-tab-pane label="湿度曲线">
     <div v-loading="isLoading">
        <div ref="humEchart" style="width: 1450px;height: 650px;"></div>
     </div></el-tab-pane>
  <el-tab-pane label="气压曲线">
     <div v-loading="isLoading">
        <div ref="preEchart" style="width: 1450px;height: 650px;"></div>
     </div></el-tab-pane>
</el-tabs>
二、返回数据,初始loading为true
 export default {
    name: "index",
    data() {
      return {
        isLoading: true,
      }
    }
  }
三、设置loading显示,获取数据后isLoading=false
  created() {
    this.getList();
  },
  methods: {
    getList() {
      this.isLoading = true;
      this.queryParams.params = {};
      listDevice(this.queryParams).then((response) => {
        this.deviceData = response.data;
        this.dateTime = response.data.date;
        this.tempCurve();
        this.humCurve();
        this.preCurve();
      }).catch((error) => {
        console.error('获取数据时出错:', error);
        this.isLoading = false;
      }).finally(() => {
        this.isLoading = false;
      });
    },
四、echarts的数据,不需要对loading进行操作
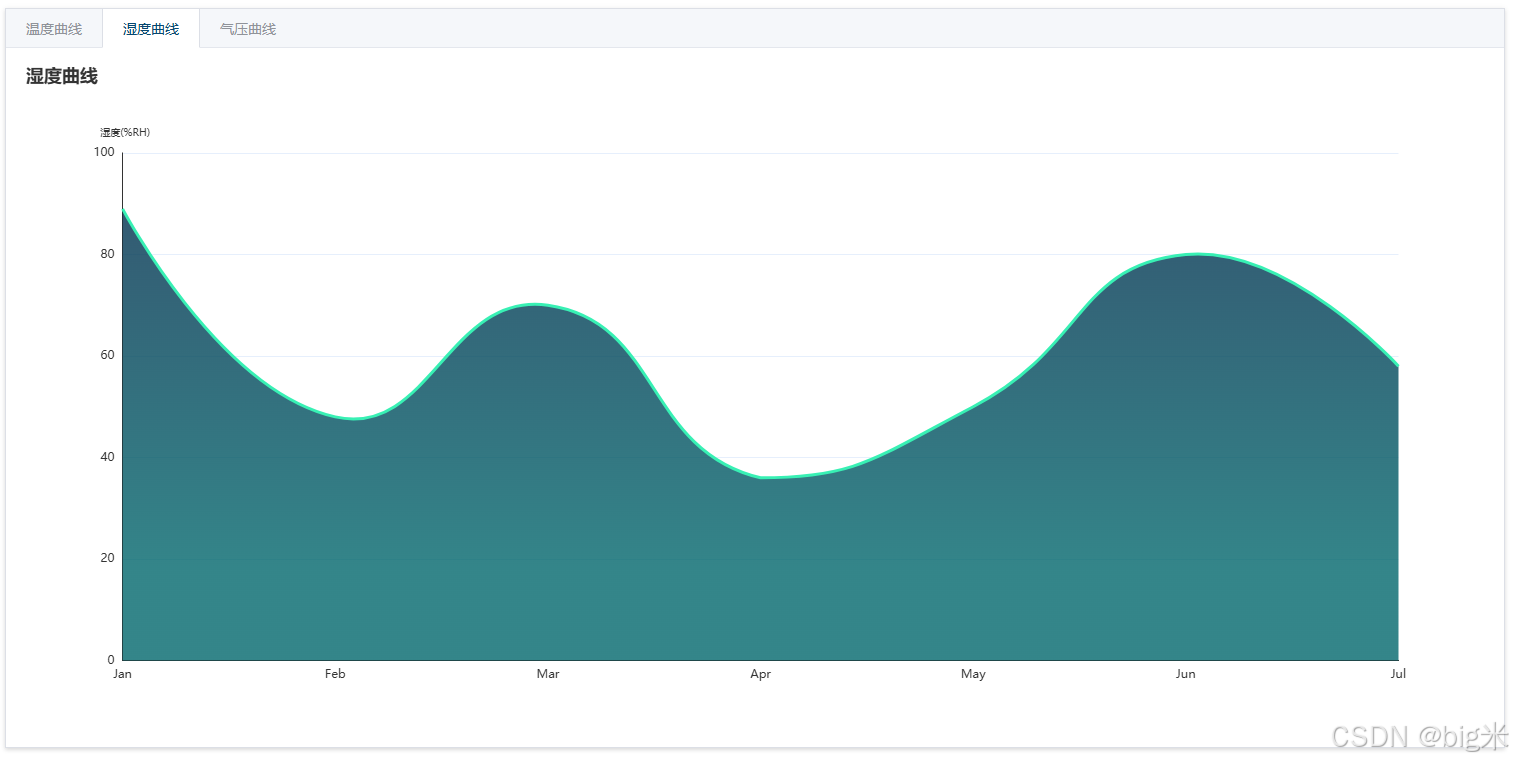
  humCurve() {
      const chart = echarts.init(this.$refs.humEchart);
      const defaultOption = {
        title: {
          text: "湿度曲线",
          top: 0,
          left: "left",
        },
        tooltip: {
            trigger: "axis",
        },
        legend: {},
        // backgroundColor: '#30333C',
        grid: {
            left: "5%",
            right: "5%",
            bottom: "5%",
            top: 90,
            // 是否包含文本
            containLabel: true
        },
        xAxis: {
            type: "category",
            data: ["Jan", "Feb", "Mar", "Apr", "May", "Jun", "Jul"],
            axisTick: { // 隐藏 X 轴的刻度线
                show: false
            },
            axisLabel: { // 自定义 X 轴的标签
                show: true,
            },
            interval: 250,
            boundaryGap: false// 设置 X 轴从最左边开始
        },
        yAxis: {
            name: "湿度(%RH)",
            nameTextStyle: {
                fontSize: 10, // 单位文本字体大小
                padding: [0, 0, 0, 5], // 单位与轴线之间的距离
            },
            type: "value",
            splitLine: {
                lineStyle: {
                    color: "#e6effc",
                },
            },
            axisLabel: { // 自定义 X 轴的标签
                show: true,
            },
            axisTick: { // 隐藏 X 轴的刻度线
                show: false
            },
        },
        series: [
            {
            'type': 'line',
            'data': [89,48,70,36,50,80,58],
            smooth: true,
            lineStyle: {
                color: '#38F0B4',
                width: 3
            },
            showSymbol: false,
            areaStyle: {
                opacity: 0.8,
                color: new echarts.graphic.LinearGradient(0, 0, 0, 1, [
                { offset: 0, color: '#00314F' },
                { offset: 0.8, color: '#01676C' }
                ])
            },
            itemStyle: {
            color: '#38F0B4'
        }
        }
        ]};

      chart.setOption(defaultOption);
    },


 1307
1307

 被折叠的 条评论
为什么被折叠?
被折叠的 条评论
为什么被折叠?
 到【灌水乐园】发言


