


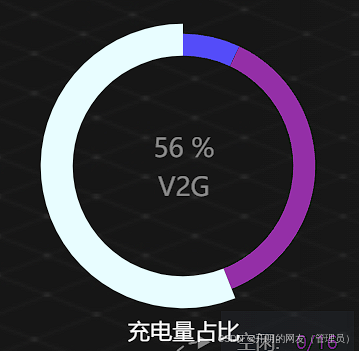
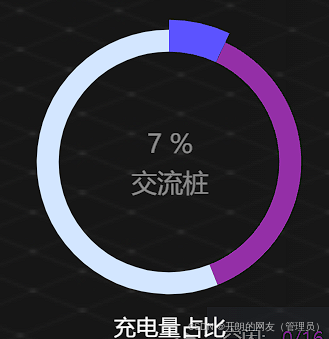
需求:中间数据自动变化,且饼图选中也会跟着变化
运行效果图:
核心代码
    //取消上一个高亮
    pieElement.dispatchAction({
      type: 'downplay',
      seriesIndex: 0,
      dataIndex: 0
    });

    //设置下一个高亮
    pieElement.dispatchAction({
      type: 'highlight',
      seriesIndex: 0,
      dataIndex: 1
    });
我的完整代码
// 创建DOM元素
const pieElementRef = ref(null);
const pieList = ref([
  { value: 7, name: '交流桩' ,itemStyle:{color:"#544cf9"}},
  { value:37, name: '液冷超充',itemStyle:{color:"#942fa7"} },
  { value: 56, name: 'V2G',itemStyle:{color:"#d3e6ff"} },
]);
const pieIndex = ref(0);


/**
 * 圆环图
 */
function setPieFun(){
  const pieElement = echarts.init(pieElementRef.value);
  const option = {
    theme:'dark',
    tooltip: {
      trigger: 'item'
    },
    legend: {
      show: false
    },
    series: [
      {
        name: '充电量占比',
        type: 'pie',
        radius: ['75%', '90%'],
        avoidLabelOverlap: false,
        label: {
          show: false,
          position: 'center',
          style: {}
        },
        emphasis: {
          label: {
            show: false,
            fontSize: 12,
          }
        },
        labelLine: {
          show: false
        },
        data: [
          { value: 7, name: '交流桩' ,itemStyle:{color:"#544cf9"}},
          { value:37, name: '液冷超充',itemStyle:{color:"#942fa7"} },
          { value: 56, name: 'V2G',itemStyle:{color:"#d3e6ff"} },
        ]
      }
    ]
  };
  pieElement.setOption(option);
  // 设置定时器,2秒后放大第一块区域
  setPieIndexFun(pieElement)
}
function setPieIndexFun(pieElement){
  intervalId.value = setInterval(()=>{
  if (pieElement!=null){
    //取消当前高亮
    pieElement.dispatchAction({
      type: 'downplay',
      seriesIndex: 0,
      dataIndex: pieIndex.value
    });
    //计算索引
    let len = pieList.value.length || 0;
     if (len >=1){
          if (pieIndex.value<len-1){
            pieIndex.value = pieIndex.value + 1
          }else {
            pieIndex.value = 0
          }
     }else {
       pieIndex.value = 0
     }
     //设置高亮
    pieElement.dispatchAction({
      type: 'highlight',
      seriesIndex: 0,
      dataIndex: pieIndex.value
    });
}
  },3000)
}
     <div class="w-full relative" style="height: calc(100% - 2rem);">
             <div class="w-full h-full" ref="pieElementRef"></div>
             <div class="absolute w-full -z-10 top-0 h-full flex items-center justify-center flex-col"  style="font-size: 0.8rem;">
                <div>{{(pieList[pieIndex]?.value /pieTotal * 100).toFixed(0)  || 0}} %</div>
                <div>{{pieList[pieIndex]?.name || '--'}}</div>
             </div>
           </div>


 4547
4547

 被折叠的 条评论
为什么被折叠?
被折叠的 条评论
为什么被折叠?
 到【灌水乐园】发言


