


 该代码段使用Python库h5py读取降水数据,经过数据清洗,结合numpy、pandas进行处理。然后利用matplotlib和cartopy进行地图绘制,展示特定区域的降水情况,同时添加了地理特征如陆地、河流,并创建了自定义的降水颜色映射。最终生成的地图显示了指定时间的降水率分布。
import h5py
import numpy as np
import matplotlib.cm as cm
import matplotlib.colors as mcolors
import matplotlib.ticker as mticker
import matplotlib.pyplot as plt
from cartopy.io.shapereader import Reader
import cartopy.crs as ccrs
import cartopy.feature as cfeature
from cartopy.mpl.ticker import LongitudeFormatter, LatitudeFormatter
import pandas as pd

def make_Rr_cmap(levels):
    '''制作降水的colormap.'''
    nbin = len(levels) - 1
    cmap = cm.get_cmap('jet', nbin)
    norm = mcolors.BoundaryNorm(levels, nbin)
    return cmap, norm

#数据处理

def data_clean(path,extent):
    with h5py.File(str(path), 'r') as f:
        lon = pd.DataFrame(f['NS/Longitude'][:])
        lat = pd.DataFrame(f['NS/Latitude'][:])
        surfacePrecipitation = pd.DataFrame(f['NS/surfPrecipTotRate'][:])
    surfacePrecipitation.replace(-9999.9,np.nan)
    time = str(path)[40:64]
    lonmin, lonmax, latmin, latmax = extent
    mask = (lon >= lonmin) & (lon <= lonmax) & (lat >= latmin) & (lat <= latmax)
    x = pd.DataFrame(mask)
    lon_s = lon[x]
    lat_s = lat[x]
    spv_s = surfacePrecipitation[x]
    return lon_s,lat_s,spv_s,time

extent =[105,112,25,32]

path = r"D:\桌面\CMB样本\2B.GPM.DPRGMI.CORRA2018.20140703-S073130-E090403.001955.V06A.HDF5"
lon_s,lat_s,spv_s,time = data_clean(path,extent)


#画图
levels_Rr = [0.1, 0.5, 1.0, 2.0, 3.0, 5.0, 10.0, 15.0, 20.0, 25]
cmap_Rr, norm_Rr = make_Rr_cmap(levels_Rr)
extents =[106,111,26,31]

proj = ccrs.PlateCarree()
fig = plt.figure(figsize=(10, 8))
ax = fig.add_subplot(111, projection=proj)
ax.add_feature(cfeature.LAND.with_scale('50m'))
ax.xaxis.set_minor_locator(mticker.AutoMinorLocator(0.25))
ax.yaxis.set_minor_locator(mticker.AutoMinorLocator(0.25))
ax.xaxis.set_major_formatter(LongitudeFormatter(0.5))
ax.yaxis.set_major_formatter(LatitudeFormatter(0.5))
ax.set(xlim=(extents[0], extents[1]),ylim=(extents[-2], extents[-1]))

ax.tick_params(labelsize='large')
china = Reader(r"D:\桌面\bou2_4l.dbf").geometries()
ax.add_geometries(china, ccrs.PlateCarree(),
                  facecolor='none', edgecolor='black', zorder=0,linewidth=1.5)
river = Reader(r"D:\1级河流.shp").geometries()
ax.add_geometries(river, ccrs.PlateCarree(), facecolor='none', edgecolor='RoyalBlue', linewidth=1,zorder=0)
im = ax.contourf(
        lon_s, lat_s, spv_s, levels_Rr,
        cmap=cmap_Rr, norm=norm_Rr, extend='both', transform=proj,alpha=0.8
    )

plt.scatter(lon_s, lat_s,c='k',s=0.5)
ax.grid()
cb = fig.colorbar(im, ax=ax, ticks=levels_Rr)
cb.set_label('Rain Rate (mm/hr)', fontsize=15)
cb.ax.tick_params(labelsize=15)
ax.set_xticks(np.arange(extents[0], extents[1]+1, 1), crs=proj)
ax.set_yticks(np.arange(extents[-2], extents[-1]+1, 1), crs=proj)
ax.set_title(f'SurfPrecipTotRate on {time}', fontsize=20,pad=20)
plt.tick_params(labelsize=15)
plt.show()
出图: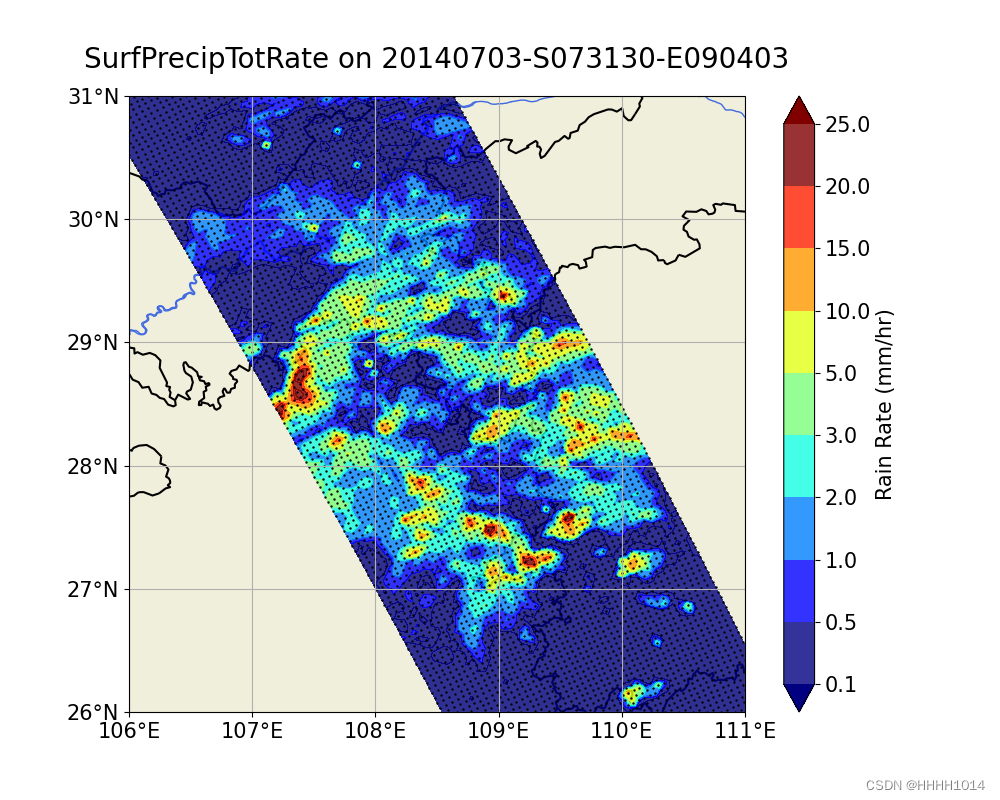


 被折叠的 条评论
为什么被折叠?
被折叠的 条评论
为什么被折叠?
 到【灌水乐园】发言


