


 本文深入探讨了TensorFlow的Python API,展示了如何构建自定义模型和训练过程。示例中,作者使用了自定义的Huber损失函数,并在加利福尼亚房屋数据集上进行了训练。模型由两个全连接层组成,使用Selu激活函数,并用Nadam优化器进行优化。通过图形方式展示了Huber损失函数与平方损失函数的区别。
记
本章深入研究了TensorFlow并介绍其底层Python API,使用TensorFlow自定义模型和训练。
例:自定义损失函数
from sklearn.datasets import fetch_california_housing
from sklearn.model_selection import train_test_split
from sklearn.preprocessing import StandardScaler

housing = fetch_california_housing()
X_train_full, X_test, y_train_full, y_test = train_test_split(
    housing.data, housing.target.reshape(-1, 1), random_state=42)
X_train, X_valid, y_train, y_valid = train_test_split(
    X_train_full, y_train_full, random_state=42)

scaler = StandardScaler()
X_train_scaled = scaler.fit_transform(X_train)
X_valid_scaled = scaler.transform(X_valid)
X_test_scaled = scaler.transform(X_test)

def huber_fn(y_true, y_pred):
    error = y_true - y_pred
    is_small_error = tf.abs(error) < 1
    squared_loss = tf.square(error) / 2
    linear_loss  = tf.abs(error) - 0.5
    return tf.where(is_small_error, squared_loss, linear_loss)

plt.figure(figsize=(8, 3.5))
z = np.linspace(-4, 4, 200)
plt.plot(z, huber_fn(0, z), "b-", linewidth=2, label="huber($z$)")
plt.plot(z, z**2 / 2, "b:", linewidth=1, label=r"$\frac{1}{2}z^2$")
plt.plot([-1, -1], [0, huber_fn(0., -1.)], "r--")
plt.plot([1, 1], [0, huber_fn(0., 1.)], "r--")
plt.gca().axhline(y=0, color='k')
plt.gca().axvline(x=0, color='k')
plt.axis([-4, 4, 0, 4])
plt.grid(True)
plt.xlabel("$z$")
plt.legend(fontsize=14)
plt.title("Huber loss", fontsize=14)
plt.show()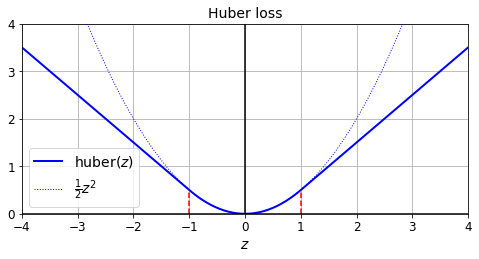
input_shape = X_train.shape[1:]

model = keras.models.Sequential([
    keras.layers.Dense(30, activation="selu", kernel_initializer="lecun_normal",
                       input_shape=input_shape),
    keras.layers.Dense(1),
])

model.compile(loss=huber_fn, optimizer="nadam", metrics=["mae"])
model.fit(X_train_scaled, y_train, epochs=2,
validation_data=(X_valid_scaled, y_valid)) 


 被折叠的 条评论
为什么被折叠?
被折叠的 条评论
为什么被折叠?
 到【灌水乐园】发言


