


数据分析(Python)
一,matplotlib
- matplotlib:最流行的Python底层绘图库,主要做数据可视化图表。
- matplotlib官方文档:http://matplotlib.org/gallery/index.html
1 折线图
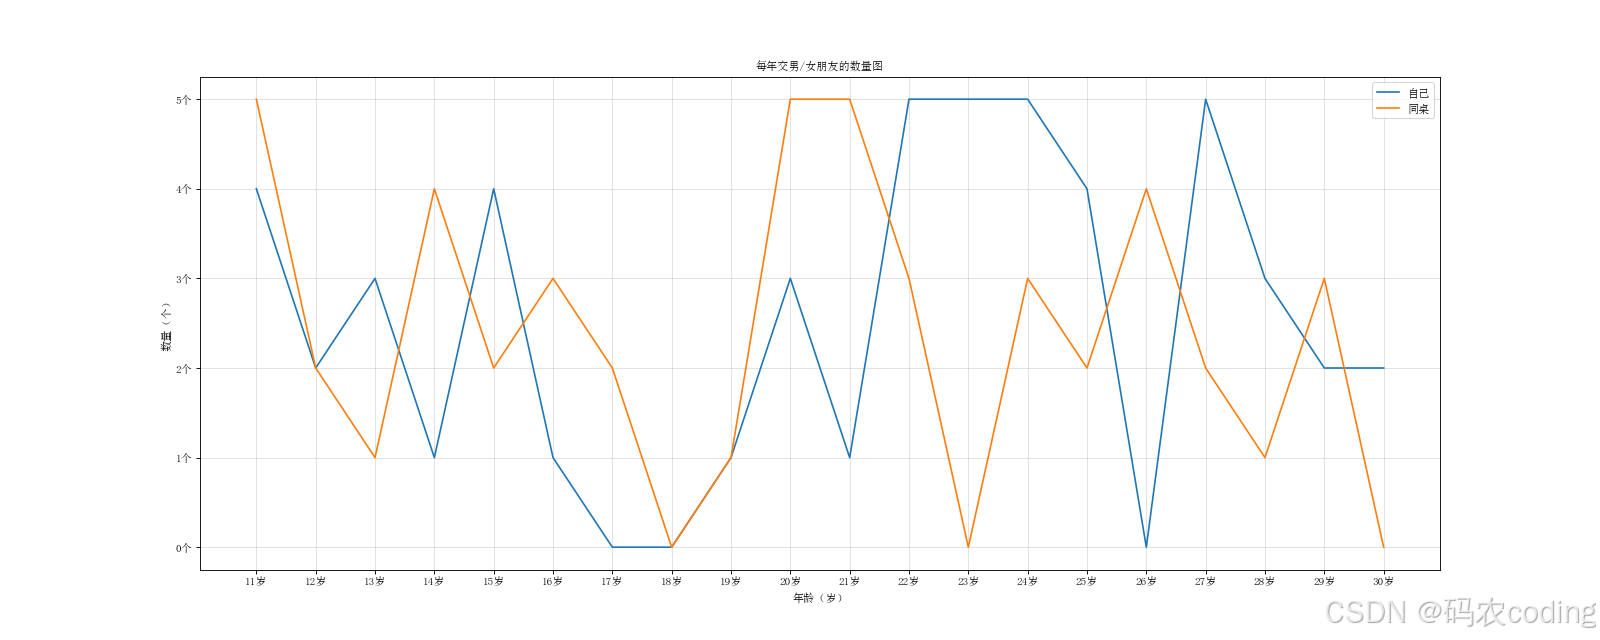
# 绘制从11岁到30岁,每年交男/女朋友的数量
import random

from matplotlib import pyplot as plt
# 解决绘制中文乱码问题
from matplotlib import font_manager

my_font = font_manager.FontProperties(fname="C:/WINDOWS/FONTS/SIMSUN.TTC")

# 设置图片大小,设置清晰程度
plt.figure(figsize=(20, 8), dpi=80)

# 图表数据
x = [i for i in range(11, 31, 1)]
y_1 = [random.randint(0, 5) for i in range(11, 31, 1)]
y_2 = [random.randint(0, 5) for i in range(11, 31, 1)]

# 设置x和y的刻度
x_ticks_labels = ["{}岁".format(i) for i in x]
y_ticks_labels = ["{}个".format(i) for i in range(0, 6)]
# 把数值型数据对应到字符串,数据的长度一样
plt.xticks(x, x_ticks_labels, fontproperties=my_font)
plt.yticks(range(0, 6), y_ticks_labels, fontproperties=my_font)

# 添加描述信息
plt.xlabel("年龄(岁)", fontproperties=my_font)
plt.ylabel("数量(个)", fontproperties=my_font)
plt.title("每年交男/女朋友的数量图", fontproperties=my_font)

# 绘制网格
plt.grid(alpha=0.4)

# 通过plot多次,绘制多个图形
plt.plot(x, y_1, label="自己")
plt.plot(x, y_2, label="同桌")

# 绘制图例(只有此处设置字体为:prop,其他地方都是fontproperties)
plt.legend(prop=my_font)

# 保存图表
# plt.savefig("./save.png")
plt.show()
- 最终效果图:
2 散点图
from matplotlib import pyplot as plt
# 解决绘制中文乱码问题
from matplotlib import font_manager
my_font = font_manager.FontProperties(fname="C:/WINDOWS/FONTS/SIMSUN.TTC")
# 设置图片大小,设置清晰程度
plt.figure(figsize=(20, 8), dpi=80)
y_1 = [11, 17, 16, 11, 12, 11, 12, 6, 6, 7, 8, 9, 12, 15, 14, 17, 18, 21, 16, 17, 20, 14, 15, 15, 15, 19, 21, 22, 22,
22, 23]
y_2 = [i for i in y_1]
y_2.reverse()
x_1 = range(1, 32, 1)
x_2 = range(51, 82, 1)
x = list(x_1) + list(x_2)
x_ticks_labels = ["3月{}日".format(i) for i in x_1]
x_ticks_labels += ["10月{}日".format(i - 50) for i in x_2]
plt.xticks(x[::3], x_ticks_labels[::3], rotation=45, fontproperties=my_font)
plt.xlabel("时间", fontproperties=my_font)
plt.ylabel("温度(摄氏度)", fontproperties=my_font)
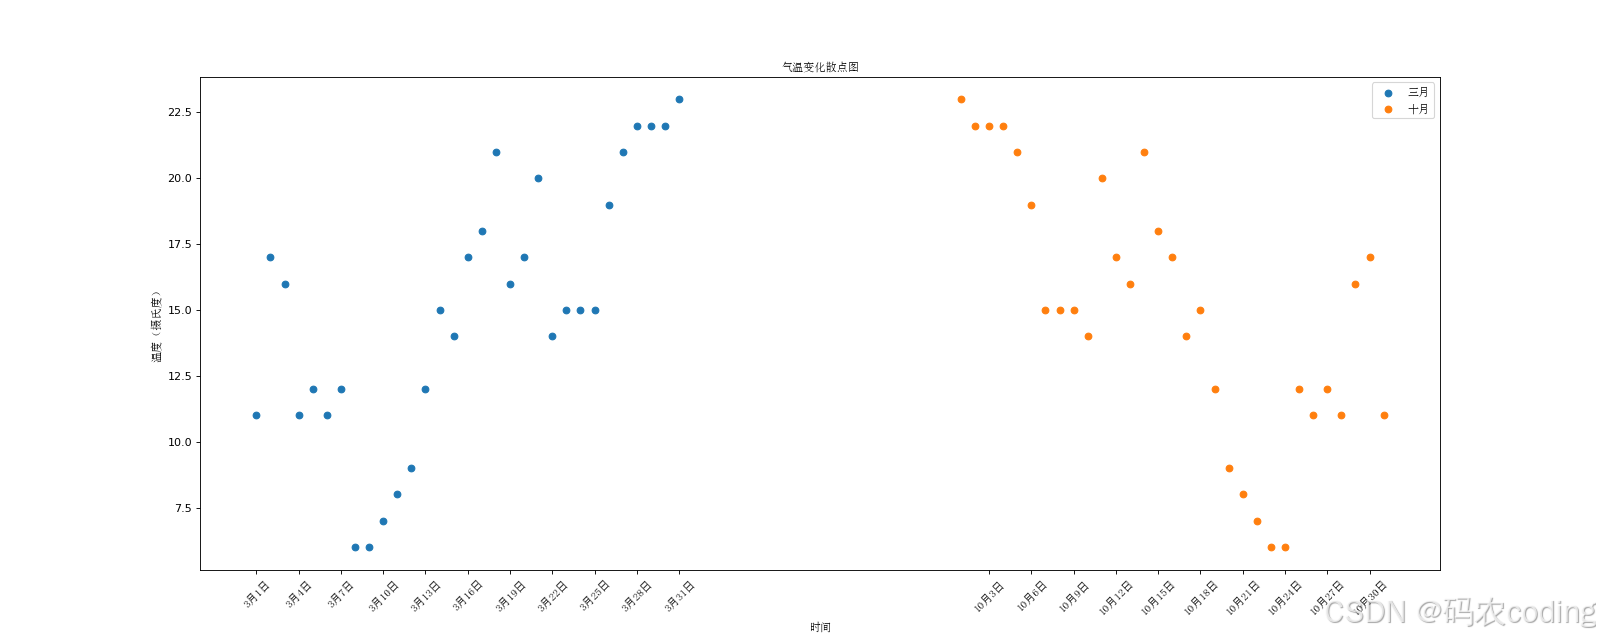
plt.title("气温变化散点图", fontproperties=my_font)
plt.scatter(x_1, y_1, label="三月")
plt.scatter(x_2, y_2, label="十月")
plt.legend(prop=my_font)
plt.show()
- 最终效果图:
3 柱状图
3.1 形式一
from matplotlib import pyplot as plt
from matplotlib import font_manager
my_font = font_manager.FontProperties(fname="C:/WINDOWS/FONTS/SIMSUN.TTC")
plt.figure(figsize=(20, 8), dpi=80)
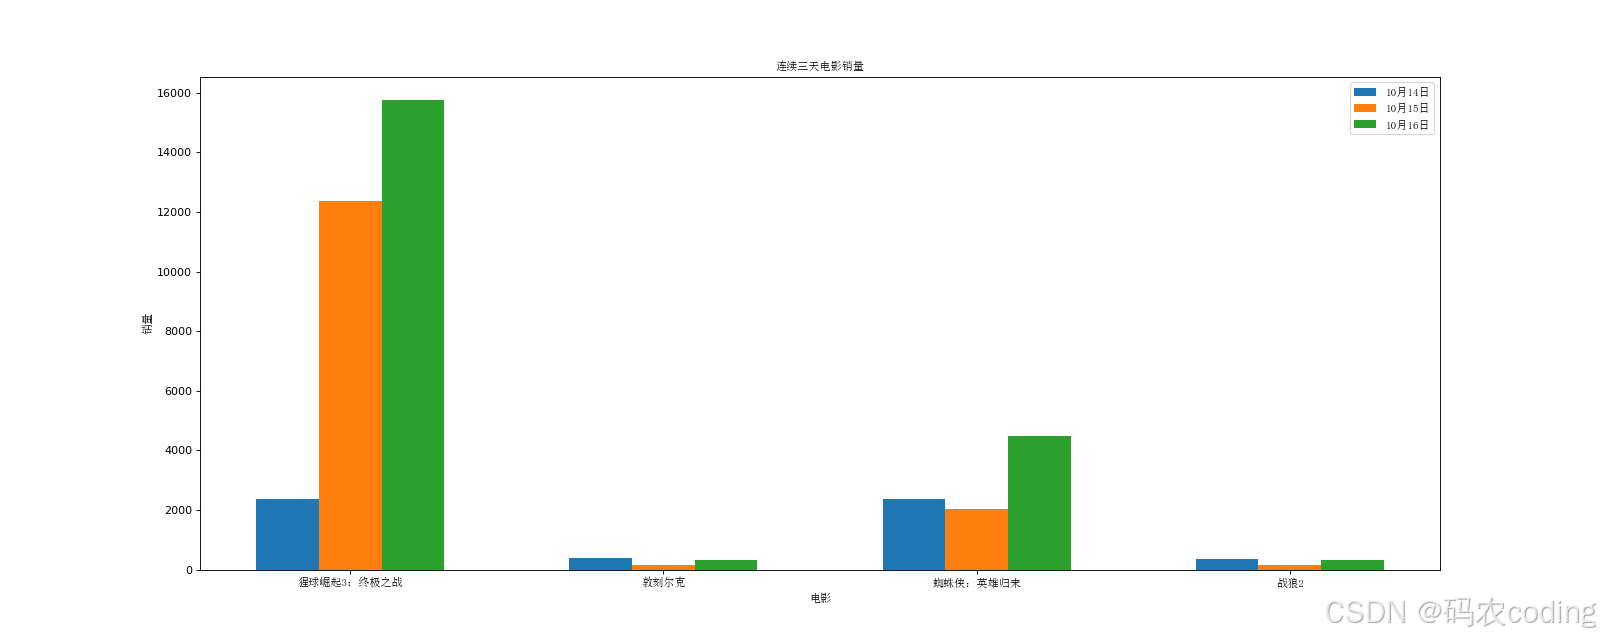
a = ["猩球崛起3:终极之战", "敦刻尔克", "蜘蛛侠:英雄归来", "战狼2"]
b_16 = [15746, 312, 4497, 319]
b_15 = [12357, 156, 2045, 168]
b_14 = [2358, 399, 2358, 362]
width = 0.2
x_1 = list(range(len(a))) # 0,1,2,3
x_2 = [i + 0.2 for i in range(len(a))] # 0.2,1.2,2.2,3.2
x_3 = [i + 0.2 * 2 for i in range(len(a))] # 0.4,1.4,2.4,3.4
plt.bar(x_1, b_14, label="10月14日", width=width)
plt.bar(x_2, b_15, label="10月15日", width=width)
plt.bar(x_3, b_16, label="10月16日", width=width)
x_tick_labels = a
plt.xticks(x_2, x_tick_labels, fontproperties=my_font)
plt.legend(prop=my_font)
plt.xlabel("电影", fontproperties=my_font)
plt.ylabel("销量", fontproperties=my_font)
plt.title("连续三天电影销量", fontproperties=my_font)
plt.savefig("./movie.png")
plt.show()
- 最终效果图:
3.2 形式二
from matplotlib import pyplot as plt
from matplotlib import font_manager
my_font = font_manager.FontProperties(fname="C:/WINDOWS/FONTS/SIMSUN.TTC")
plt.figure(figsize=(20, 8), dpi=80)
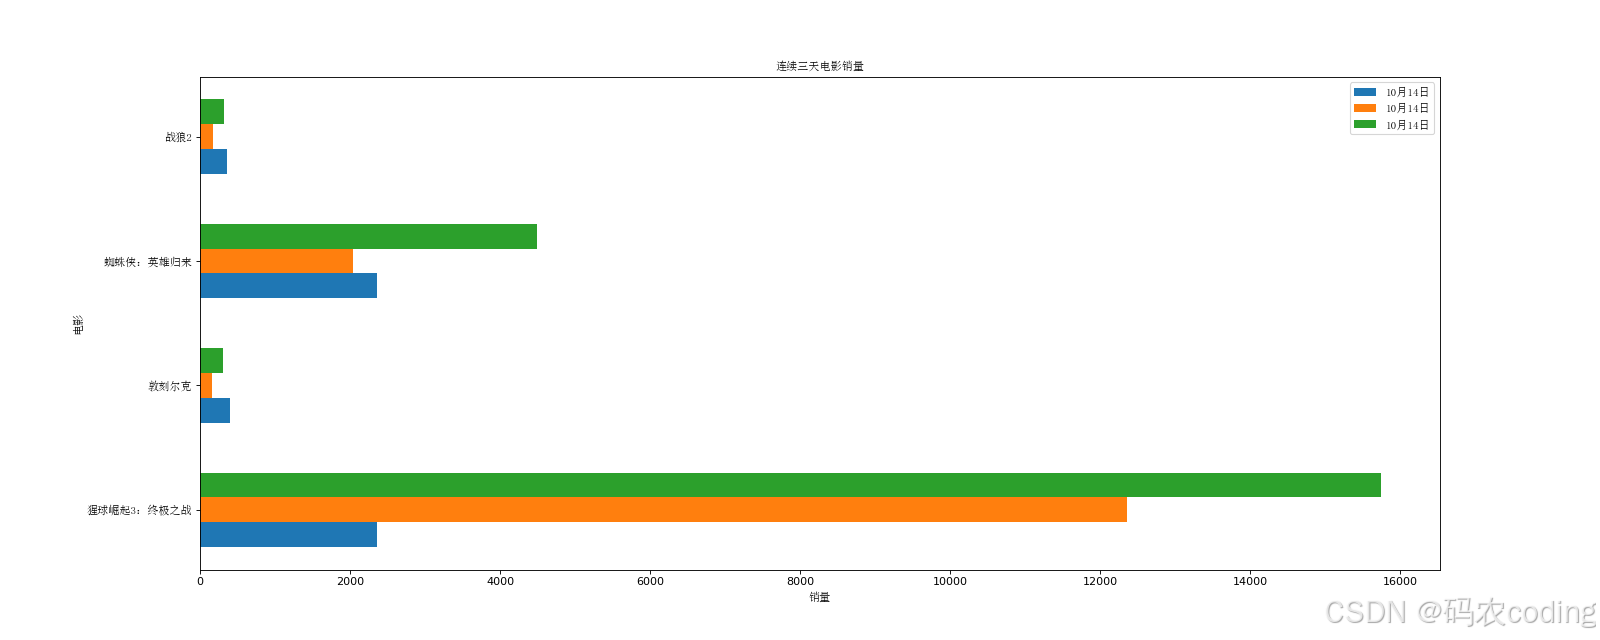
a = ["猩球崛起3:终极之战", "敦刻尔克", "蜘蛛侠:英雄归来", "战狼2"]
b_16 = [15746, 312, 4497, 319]
b_15 = [12357, 156, 2045, 168]
b_14 = [2358, 399, 2358, 362]
height = 0.2
y_1 = list(range(len(a))) # 0,1,2,3
y_2 = [i + 0.2 for i in range(len(a))] # 0.2,1.2,2.2,3.2
y_3 = [i + 0.2 * 2 for i in range(len(a))] # 0.4,1.4,2.4,3.4
plt.barh(y_1, b_14, label="10月14日", height=height)
plt.barh(y_2, b_15, label="10月14日", height=height)
plt.barh(y_3, b_16, label="10月14日", height=height)
y_tick_labels = a
plt.yticks(y_2, y_tick_labels, fontproperties=my_font)
plt.legend(prop=my_font)
plt.xlabel("销量", fontproperties=my_font)
plt.ylabel("电影", fontproperties=my_font)
plt.title("连续三天电影销量", fontproperties=my_font)
plt.savefig("./movie_h.png")
plt.show()
- 最终效果图:
二,numpy
1 数组的创建
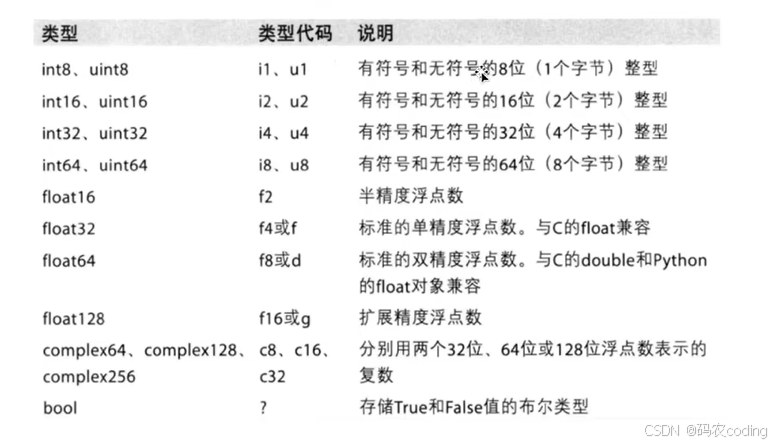
- numpy的数据类型:
import random

import numpy as np

a = np.array([1, 2, 3, 4, 5])
b = np.array(range(1, 6, 1))
c = np.arange(1, 6, 1)

print(a)
print(b)
print(c)

# 数组的类名:<class 'numpy.ndarray'>,数据的类型:int32
print(f"数组的类名:{type(a)},数据的类型:{a.dtype}")

# 返回修改后的数组类型
d = a.astype("i1")
# 数组的类名:<class 'numpy.ndarray'>,数据的类型:int8
print(f"数组的类名:{type(d)},数据的类型:{d.dtype}")

# 创建指定类型的数组
e = np.array(range(1, 6, 1), "int64")
# 数组的类名:<class 'numpy.ndarray'>,数据的类型:int64
print(f"数组的类名:{type(e)},数据的类型:{e.dtype}")

# 返回保留小数后的结果
f = np.array([random.random() for i in range(10)])
g = np.round(f, 2)
print(f"保留小数前为:{f}")
print(f"保留小数后为:{g}")
2 数组的形状
import numpy as np

a = np.array(range(24))
print(a)
print(f"a的形状为:{a.shape}")
# 将a按形状参数修改后的内容返回到b
b = a.reshape((4, 6))
print(b)
print(f"b的形状为:{b.shape}")

b = b.flatten()
print(f"b展开后:{b}\nb.shape = {b.shape}")
3 数组的计算
3.1 数组和数字进行计算
- 多维数组的每一个元素和该数字执行运算。
import numpy as np

a = np.array(range(24))
a = a.reshape((4, 6))
print(f"数组a计算前:\n{a}")
a = a + 10
print(f"数组a计算前:\n{a}")

'''
数组a计算前:
[[ 0  1  2  3  4  5]
 [ 6  7  8  9 10 11]
 [12 13 14 15 16 17]
 [18 19 20 21 22 23]]
数组a计算前:
[[  0   1   4   9  16  25]
 [ 36  49  64  81 100 121]
 [144 169 196 225 256 289]
 [324 361 400 441 484 529]]
'''
3.2 形状相同的数组进行计算
- 数组的对应元素执行相同的运算。
import random

import numpy as np

a = np.array(range(24))
a = a.reshape((4, 6))
b = np.array([random.randint(0,10) for i in range(24)])
b = b.reshape((4,6))
print(f"数组a计算前:\n{a}")
print(f"数组b计算前:\n{b}")
a = a + b
print(f"数组a计算后:\n{a}")

'''
数组a计算前:
[[ 0  1  2  3  4  5]
 [ 6  7  8  9 10 11]
 [12 13 14 15 16 17]
 [18 19 20 21 22 23]]
数组b计算前:
[[ 2  0  1  3 10 10]
 [ 3  4  6  2  5  4]
 [ 7 10  4 10  9  0]
 [ 1  8  0  0  2  0]]
数组a计算后:
[[ 2  1  3  6 14 15]
 [ 9 11 14 11 15 15]
 [19 23 18 25 25 17]
 [19 27 20 21 24 23]]
'''
3.1 形状不同的数组进行计算
import numpy as np

a = np.array(range(24))
a = a.reshape((4, 6))
b = np.array(range(6))
print(f"数组a计算前:\n{a}")
print(f"数组b计算前:\n{b}")
print(f"执行a-b后的结果为:")
c = a - b
print(f"{c}")
print("*" * 100)
'''
数组a计算前:
[[ 0  1  2  3  4  5]
 [ 6  7  8  9 10 11]
 [12 13 14 15 16 17]
 [18 19 20 21 22 23]]
数组b计算前:
[0 1 2 3 4 5]
执行a-b后的结果为:
[[ 0  0  0  0  0  0]
 [ 6  6  6  6  6  6]
 [12 12 12 12 12 12]
 [18 18 18 18 18 18]]
'''
b = np.array(range(4))
b = np.reshape(b, (4, 1))
print(f"数组a计算前:\n{a}")
print(f"数组b计算前:\n{b}")
print(f"执行a-b后的结果为:")
c = a - b
print(f"{c}")
'''
数组a计算前:
[[ 0  1  2  3  4  5]
 [ 6  7  8  9 10 11]
 [12 13 14 15 16 17]
 [18 19 20 21 22 23]]
数组b计算前:
[[0]
 [1]
 [2]
 [3]]
执行a-b后的结果为:
[[ 0  1  2  3  4  5]
 [ 5  6  7  8  9 10]
 [10 11 12 13 14 15]
 [15 16 17 18 19 20]]
'''
- 思考:
- shape为(3,3,3)的数组能够和(3,2)的数组进行计算吗?(不可以)
- shape为(3,3,2)的数组能够和(3,2)的数组进行计算吗?(可以)
- shape为(3,3,2)的数组能够和(3,3)的数组进行计算吗?(可以)
- 从生成数组的不同角度理解是否可以进行计算。

4 读取和存储数据
4.1 读取数据
import numpy as np

file_src = "./data.csv"

# delimiter为分割字符串
a = np.loadtxt(file_src,dtype=int,delimiter=",")
# 数据的转置
a = a.transpose()
print(a)
4.2 索引和切片
import numpy as np

file_src = "./data.csv"

# delimiter为分割字符串
a = np.loadtxt(file_src,dtype=int,delimiter=",")

print(a)
print("*"*100)

# 取指定的行和列
print(a[0,0])
print(a[:,0])   # 所有行,0列
print(a[[2,4,5],1:])    # 2,4,5行,1列及之后的所有数据

# 取指定多个元素
print(a[[1,2],[1,0]])
4.3 数据的修改
import numpy as np

a = np.arange(24).reshape((4, 6))
print(a)

print("*" * 100)
print(a < 10)

print("*" * 100)
a = np.where(a < 10, 0, 10)  # 将a中小于10的替换成0,大于等于10的替换成10
print(a)

print("*" * 100)
a = np.arange(24).reshape((4, 6))
a = a.astype("float")
a[3, 3:] = np.nan
print(a)
print("*" * 100)
a = a.clip(10, 18)  # 将a中小于10的替换成10,大于18的替换成18
print(a)  # 但是nan没有被替换
4.4 常用方法
import numpy as np

t1 = np.arange(24).reshape((4, 6))
# 数组的拼接
# 竖直拼接
t2 = np.arange(12).reshape((2, 6))
print(np.vstack((t1, t2)))
print("*" * 100)
# 水平拼接
t3 = np.arange(4).reshape((4, 1))
print(np.hstack((t1, t3)))
print("*" * 100)
# 交换数据的行列
# 交换行
t1[[1, 2], :] = t1[[2, 1], :]
print(t1)
print("*" * 100)
t1 = np.arange(24).reshape((4, 6))
t1[:, [1, 2]] = t1[:, [2, 1]]
print(t1)
print("*" * 100)
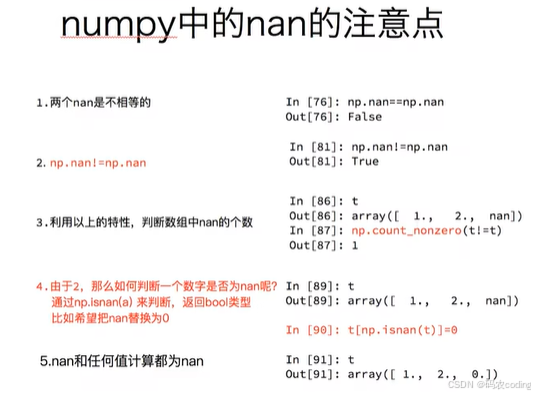
4.5 NAN

import numpy as np


# 填充数组中的nan值,用平均值取填充
def fill_nan_mean(t):
    for i in range(t.shape[1]):
        temp_col = t[i, :]
        nan_num = np.count_nonzero(np.isnan(temp_col))
        if nan_num != 0:
            # np.nan != np.nan True  np.nan == np.nan  False
            temp_not_nan_col = temp_col[temp_col == temp_col]
            # 选中当前为nan的位置,把值赋值为均值
            # temp_col[np.isnan(temp_col)] = np.mean(temp_not_nan_col)
            temp_col[temp_col != temp_col] = np.mean(temp_not_nan_col)


# 填充数组中的nan值,用中值取填充
# 中值:中点值,又称中位数,排序后,取数组中间位置的元素
def fill_nan_median(t):
    for i in range(t.shape[1]):
        temp_col = t[i, :]
        nan_num = np.count_nonzero(np.isnan(temp_col))
        if nan_num != 0:
            # np.nan != np.nan True  np.nan == np.nan  False
            temp_not_nan_col = temp_col[temp_col == temp_col]
            # 选中当前为nan的位置,把值赋值为均值
            # temp_col[np.isnan(temp_col)] = np.mean(temp_not_nan_col)
            temp_col[temp_col != temp_col] = np.median(temp_not_nan_col)


t = np.arange(9).reshape((3, 3))
t = t.astype("float64")
t[2, 2] = np.nan
print(t)
print("*" * 100)
# fill_nan_mean(t)
fill_nan_median(t)
print(t)
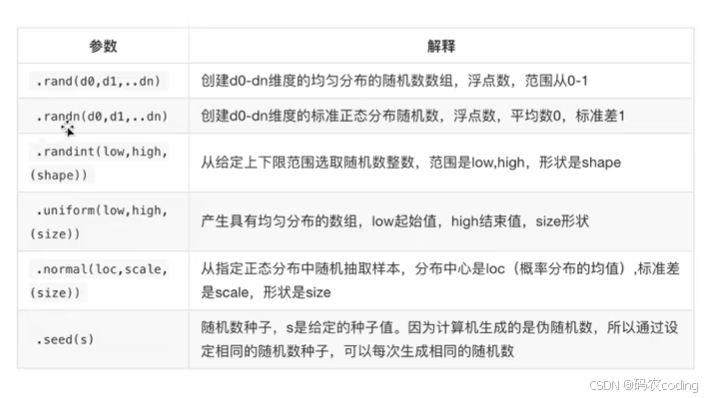
4.6 生成随机数
4.7 copy和view

三,pandas
- numpy能够帮助我们处理数值,但是pandas除了处理数值之外(基于numpy),还能够帮我们处理其他类型的数据。
1 pandas常用数据类型
1.1 Series
- Series:一维,带标签数组。
- 切片:直接传入start end或者步长即可。
- 索引:一个的时候直接传入序号或者index,多个的时候传入序号或者index列表。
import string

import pandas as pd

a = {string.ascii_uppercase[i]: i for i in range(10)}
print(a)
print(type(a))
print("*" * 100)
b = pd.Series(a)
print(b)
print(type(b))
print("*" * 100)
# 重新给其指定索引之后,如果能够对应上,就取其值,如果不能,就为Nan
c = pd.Series(a, index=list(string.ascii_uppercase[5:15]))
print(c)

print("*" * 100)
t1 = {"name": "Jack", "age": 18, "sex": "male"}
t1 = pd.Series(t1)
print(t1)
print(type(t1))
print(t1.index)
print(type(t1.index))
print(t1.values)
print(type(t1.values))

print("*" * 100)
print(t1[0])  # 取指定一个值
print("*" * 100)
print(t1[[0, 1]])  # 取指定多个值
print("*" * 100)
print(t1[1:])  # 取索引1之后的所有内容
print("*" * 100)
print(t1[:1])  # 取索引1之前的所有内容
print("*" * 100)
print(t1["name"])   # 通过key取内容
print("*" * 100)
print(t1[["name", "age"]])
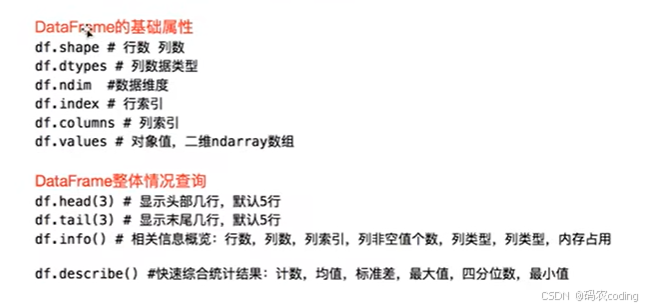
1.2 DataFrame
- DataFrame:二维,Series容器。
- DataFrame对象既有行索引,又有列索引。
- 行索引,表明不同行,横向索引,index,0轴,axis=0。
- 列索引,表明不同列,纵向索引,columns,1轴,axis=1。
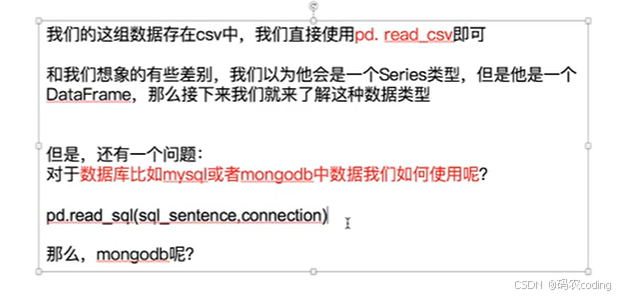
2 pandas读取外部数据


 被折叠的 条评论
为什么被折叠?
被折叠的 条评论
为什么被折叠?
 到【灌水乐园】发言


