


 本文介绍了一个Vue组件如何通过父组件向子组件传递数据,以及如何使用ECharts库在子组件中动态创建和更新折线图,展示迁入迁出人数的数据变化。
示例图
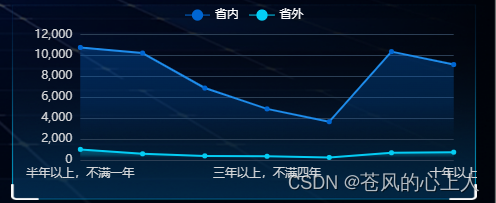
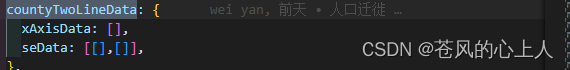
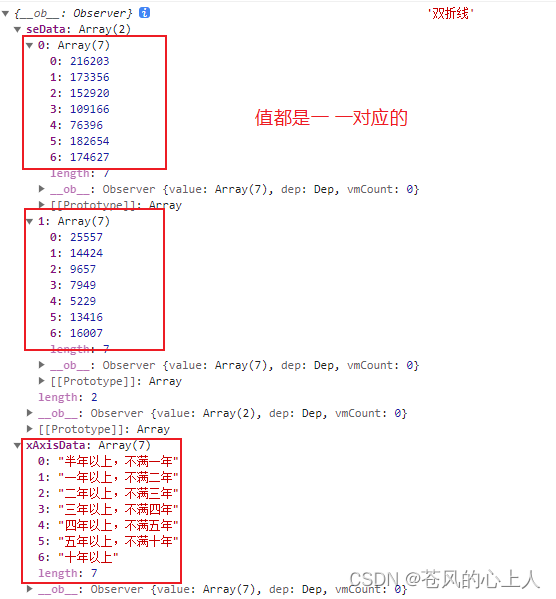
通过父传子,数据格式是
组件代码
<template>
  <div class="rowBarChart" :id="id"></div>
</template>

<script>
import * as echarts from "echarts";
export default {
  props: {
    id: {
      type: String,
      default: "",
    },
    data: {
      type: Object,
      default: {},
    },
  },
  watch: {
    data: {
      handler(newVal, oldVal) {
        if (newVal.seData) {
          this.$nextTick(() => {
            this.init();
          });
        }
      },
      deep: true,
      immediate: true,
    },
  },
  data() {
    return {
      option: {
        tooltip: {
          trigger: "axis",
          axisPointer: {
            type: "none",
          },
          backgroundColor: "rgba(	248,248,255,0.9)", //设置背景图片 rgba格式
          borderWidth: "1", //边框宽度设置1
          borderColor: "#3EB6F5", //设置边框颜色
          textStyle: {
            color: "#3C3A3A", //设置文字颜色
          },
        },
        grid: {
          top: "18%",
          left: "5%",
          right: "5%",
          bottom: "10%",
          containLabel: true,
        },
        legend: {
          top: "3%",
          textStyle: {
            color: "#FFF",
          },
          data: ["迁入人数", "迁出人数"],
        },
        xAxis: {
          type: "category",
          data: [
            "2012",
            "2013",
            "2014",
            "2015",
            "2016",
            "2017",
            "2018",
            "2019",
          ],
          axisLine: {
            show: false,
          },
          axisTick: {
            show: false,
          },
          axisLabel: {
            textStyle: {
              color: "#D4D5D7",
            },
          },
          boundaryGap: false,
        },
        yAxis: {
          type: "value",
          axisLine: {
            lineStyle: {
              color: "#B2E7FF",
            },
          },
          axisLine: {
            show: false,
          },
          axisTick: {
            show: false, // 是否显示坐标轴刻度
            alignWithLabel: true, //设置x轴刻度线与x轴文字对齐的
            inside: true, // 坐标轴刻度是否朝内,默认朝外
            length: 5,
          },
          splitLine: {
            show: true,
            lineStyle: {
              color: "RGBA(44, 63, 85, 1)",
            },
          },
          axisLabel: {
            textStyle: {
              color: "#D4D5D7",
            },
          },
        },
        series: [
          {
            name: "省内",
            type: "line",
            smooth: false,
            symbol: "circle",
            symbolSize: 5,
            showSymbol: true,
            lineStyle: {
              normal: {
                width: 2,
                color: "#1E8CEB",
              },
            },
            areaStyle: {
              normal: {
                color: new echarts.graphic.LinearGradient(
                  0,
                  0,
                  0,
                  1,
                  [
                    {
                      offset: 0,
                      color: "rgba(0, 102, 210, 0.5)",
                    },
                    {
                      offset: 0.5,
                      color: "rgba(0, 102, 210, 0.3)",
                    },
                    {
                      offset: 0.8,
                      color: "rgba(0, 102, 210, 0)",
                    },
                  ],
                  false
                ),
                shadowColor: "rgba(0, 0, 0, 0.1)",
                shadowBlur: 10,
              },
            },
            itemStyle: {
              normal: {
                color: "rgb(0, 102, 210)",
              },
            },
            data: [220, 182, 191, 134, 150, 120, 110, 125, 145, 122, 165, 122],
          },
          {
            name: "省外",
            type: "line",
            smooth: false,
            symbol: "circle",
            symbolSize: 5,
            showSymbol: true,
            lineStyle: {
              normal: {
                width: 2,
                color: "#04CDF4",
              },
            },
            areaStyle: {
              normal: {
                color: new echarts.graphic.LinearGradient(
                  0,
                  0,
                  0,
                  1,
                  [
                    {
                      offset: 0,
                      color: "rgba(4, 205, 244, 0.5)",
                    },
                    {
                      offset: 0.5,
                      color: "rgba(4, 205, 244, 0.3)",
                    },
                    {
                      offset: 0.8,
                      color: "rgba(4, 205, 244, 0)",
                    },
                  ],
                  false
                ),
                shadowColor: "rgba(0, 0, 0, 0.1)",
                shadowBlur: 10,
              },
            },
            itemStyle: {
              normal: {
                color: "rgb(4, 205, 244)",
              },
            },
            data: [220, 182, 191, 134, 150, 120, 110, 125, 145, 122, 165, 122],
          },
        ],
      },
    };
  },
  methods: {
    init() {
      let Chart = echarts.init(document.getElementById(this.id));
      this.option.legend.data = this.data.legendData;
      this.option.xAxis.data = this.data.xAxisData;
      this.option.series[0].data = this.data.seData[0];
      this.option.series[1].data = this.data.seData[1];

      Chart.setOption(this.option);

      window.onresize = () => {
        Chart.resize();
      };
    },
  },
};
</script>

<style lang="scss" scoped>
.rowBarChart {
  height: 100%;
  width: 100%;
}
</style>


 364
364

 被折叠的 条评论
为什么被折叠?
被折叠的 条评论
为什么被折叠?
 到【灌水乐园】发言


