


拟合数据
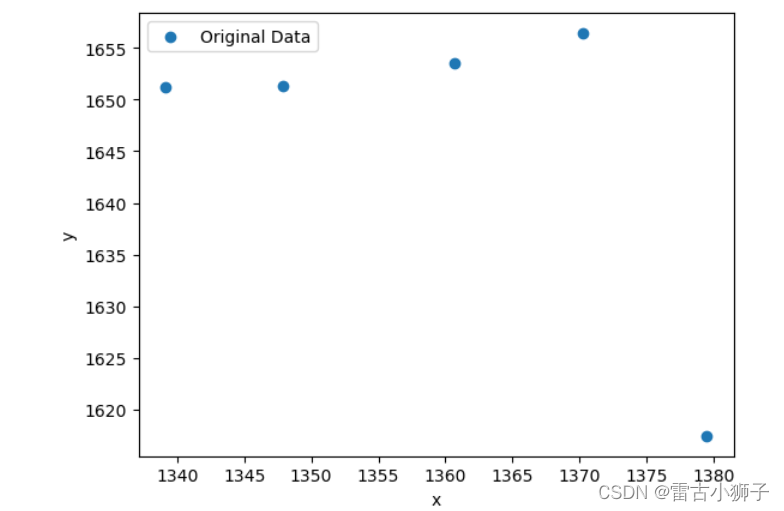
该组数据无明显关系,无法拟合,由于最终模型训练使用前两组数据,因此,将对数据进行相关性分析,查看哪个特征与前两个特征有线性相关关系,并替代原有特征
import pandas as pd
import numpy as np
import matplotlib.pyplot as plt

# 读取数据
data = pd.read_csv('D:/JupyterNotebook/寒假/Myjupyter/zhw/血糖/2024.01.15/大板子高血糖数据.csv')
x = data.drop(['name','glucose','age','armTemp','enviTemp'],axis = 1)

# 选择要分析的特征
target_feature = 'Pha_10.0'
other_features = x.drop(columns=target_feature)

other_features = other_features.columns.tolist()

type(other_features)
# 绘制散点图
for feature in other_features:
    plt.scatter(x[feature], x[target_feature], label=feature)

plt.xlabel('Other Features')
plt.ylabel('Target Feature')
plt.legend()
plt.show()
# 计算相关系数
correlation_matrix = data[other_features + [target_feature]].corr()
# print(correlation_matrix)
target_correlation = correlation_matrix.loc[target_feature, other_features]

print(target_correlation)
type(target_correlation)
target_correlation.abs().sort_values(ascending=False)
降序排列后,使用线性关系最强的特征代替原有特征
2024.02.28
因数据不平衡,将以前的数据进行拟合。
查看数据间的关系
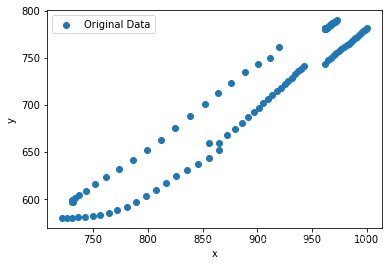
由上图可得,数据间的关系是一段一段的。为了高效的拟合数据,先筛选特征。
读取数据
from sklearn.decomposition import PCA
from sklearn.svm import SVR
from sklearn.tree import DecisionTreeRegressor
import pandas as pd
from sklearn.feature_selection import SelectKBest,RFE,SelectFromModel
import seaborn as sns
import numpy as np
import matplotlib.pyplot as plt
 最低0.47元/天 解锁文章


 被折叠的 条评论
为什么被折叠?
被折叠的 条评论
为什么被折叠?
 到【灌水乐园】发言


