


学习曲线
如果模型在训练数据上表现良好,但根据交叉验证的指标泛化较差,则你的模型过拟合。如果两者的表现均不理想,则说明欠拟合
- 均方误差 mean squared error
- 训练测试分 train_test_split
from sklearn.metrics import mean_squared_error
from sklearn.model_selection import train_test_split
import numpy as np
import matplotlib.pyplot as plt

X=np.random.randn(100,1)
y=4+3*X+np.random.randn(100,1)
#learning_curves 学习曲线
def plot_learning_curves(model,X,y):
    X_train,X_val,y_train,y_val=train_test_split(X,y,test_size=0.2)
    train_errors,val_errors=[],[]
    #使用交叉验证
    for m in range(1,len(X_train)):#从使用两个数据开始拟合
        model.fit(X_train[:m],y_train[:m])#使用前m个训练集
        y_train_predict=model.predict(X_train[:m])#得出前m个训练集y的预测值
        y_val_predict=model.predict(X_val)#获得验证集预测值
        train_errors.append(mean_squared_error(y_train[:m],y_train_predict))
        #使用mean_squared_error获得训练集预测值均方误差
        val_errors.append(mean_squared_error(y_val,y_val_predict))
        #使用mean_squared_error获得验证集预测值均方误差
    plt.plot(np.sqrt(train_errors), "r-+", linewidth=2, label="train")
    plt.plot(np.sqrt(val_errors), "b-", linewidth=3, label="val")
    plt.legend(loc="upper right", fontsize=14)   # 曲线标注
    plt.xlabel("Training set size", fontsize=14) # x轴标签
    plt.ylabel("RMSE", fontsize=14)              # y轴标签
    plt.axis([0, 80, 0, 5])
    plt.show()
#线性回归模型实例
lin_reg=LinearRegression()
#调用学习曲线函数
plot_learning_curves(lin_reg,X,y)
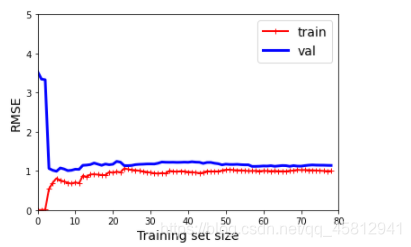
这种情况属于欠拟合,模型损失较高,且训练集曲线与验证集曲线中间的距离较近,使用更多的数据集训练也是无济于事,
在相同数据上的10阶多项式模型的学习曲线
from sklearn.pipeline import Pipeline
#定义流水线
polynomial_regression=Pipeline([
    ("poly_features",PolynomialFeatures(degree=10,include_bias=False)),#多项式特征
    ("lin_reg",LinearRegression())#线性模型
])
plot_learning_curves(polynomial_regression,X,y)
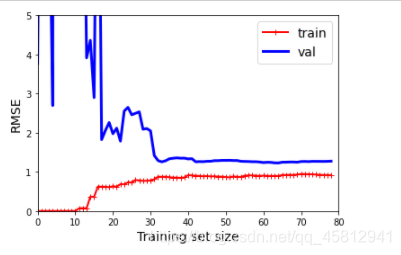
曲线之间存在间隙。这意味着该模型在训练数据上的性能要比在验证数据上的性能
好得多,这是过拟合模型的标志。但是,如果你使用更大的训练集,则两条曲线会继续接
近


 被折叠的 条评论
为什么被折叠?
被折叠的 条评论
为什么被折叠?
 到【灌水乐园】发言


