程序代码如下:
clear
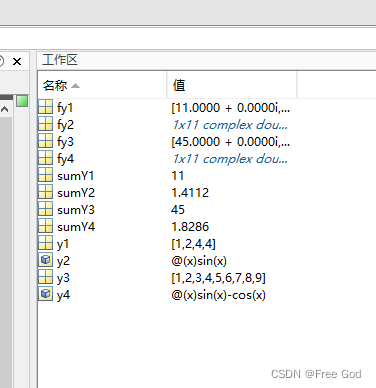
y1 = [1 2 4 4];
[fy1,sumY1] = Fourier2(y1);
y2 = @(x) sin(x);
[fy2,sumY2] = Fourier2(y2,1,0,10);
y3 = [1 2 3 4 5 6 7 8 9 ];
[fy3,sumY3] = Fourier2(y3);
y4 = @(x) sin(x)-cos(x);
[fy4,sumY4] = Fourier2(y4,1,0,10);
程序运行图如下:
1、对变量的截图
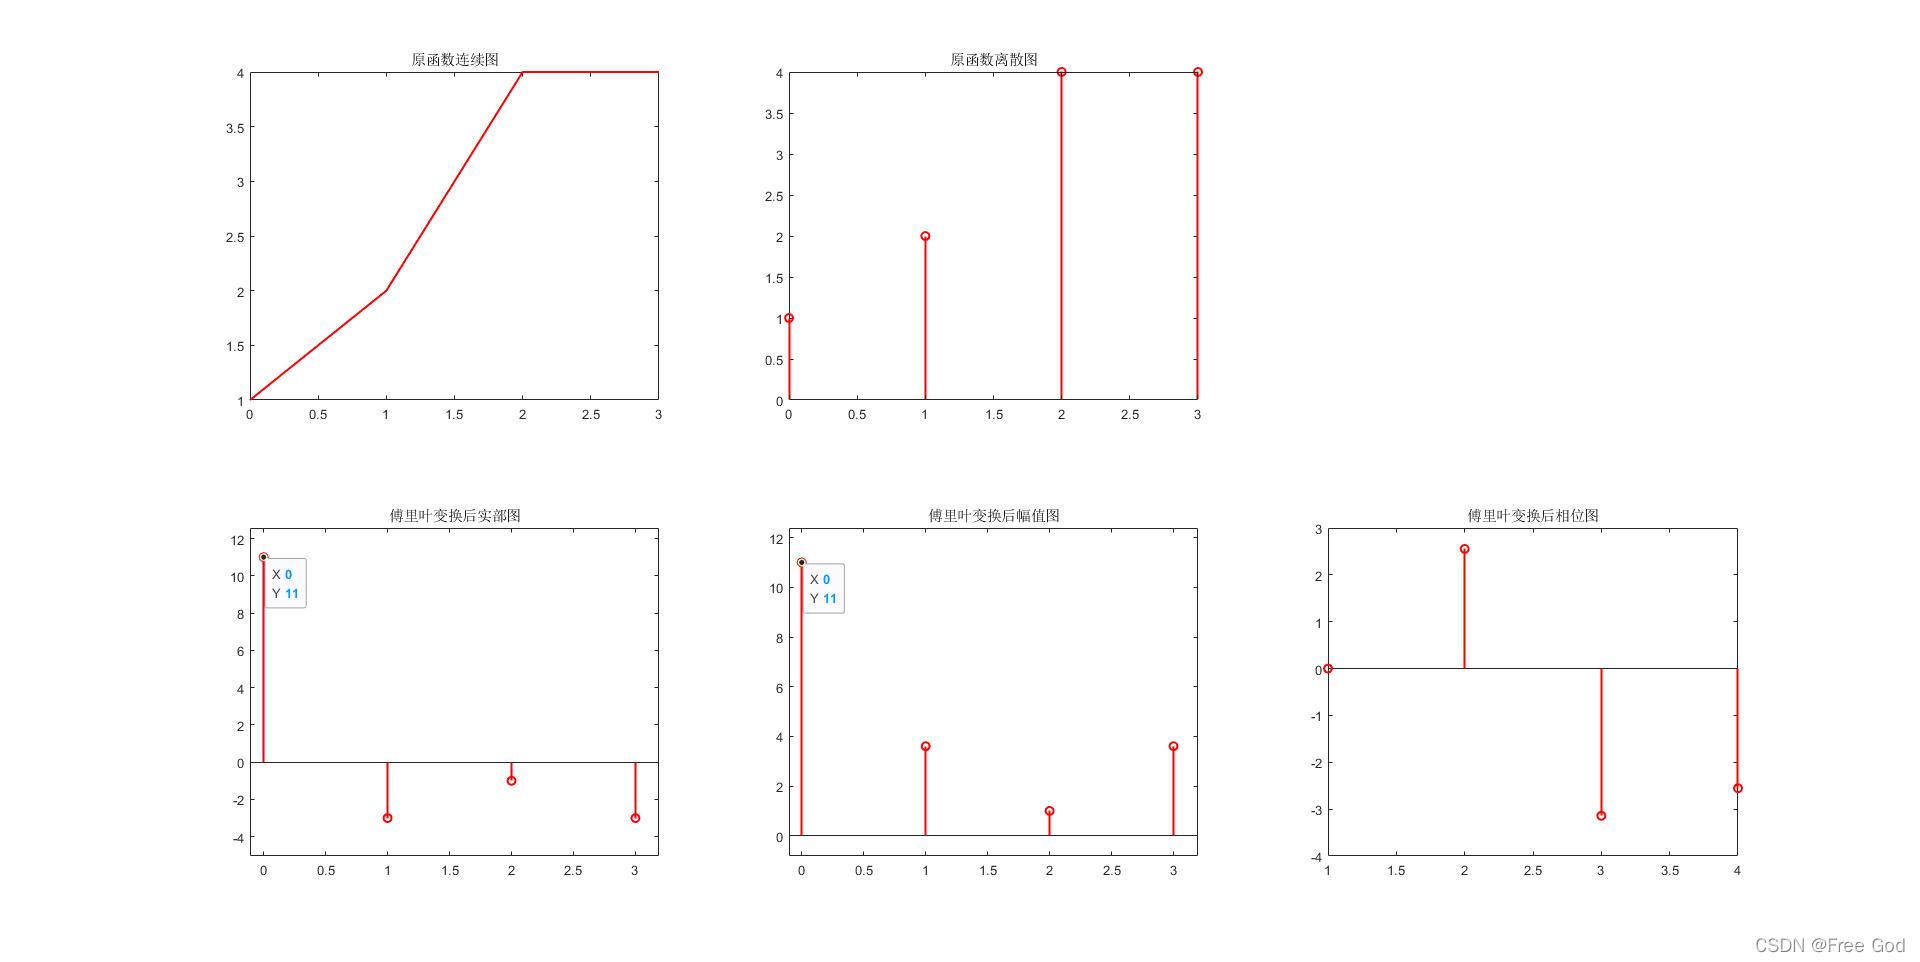
1、对 y = [1 2 4 4]进行离散傅里叶变换
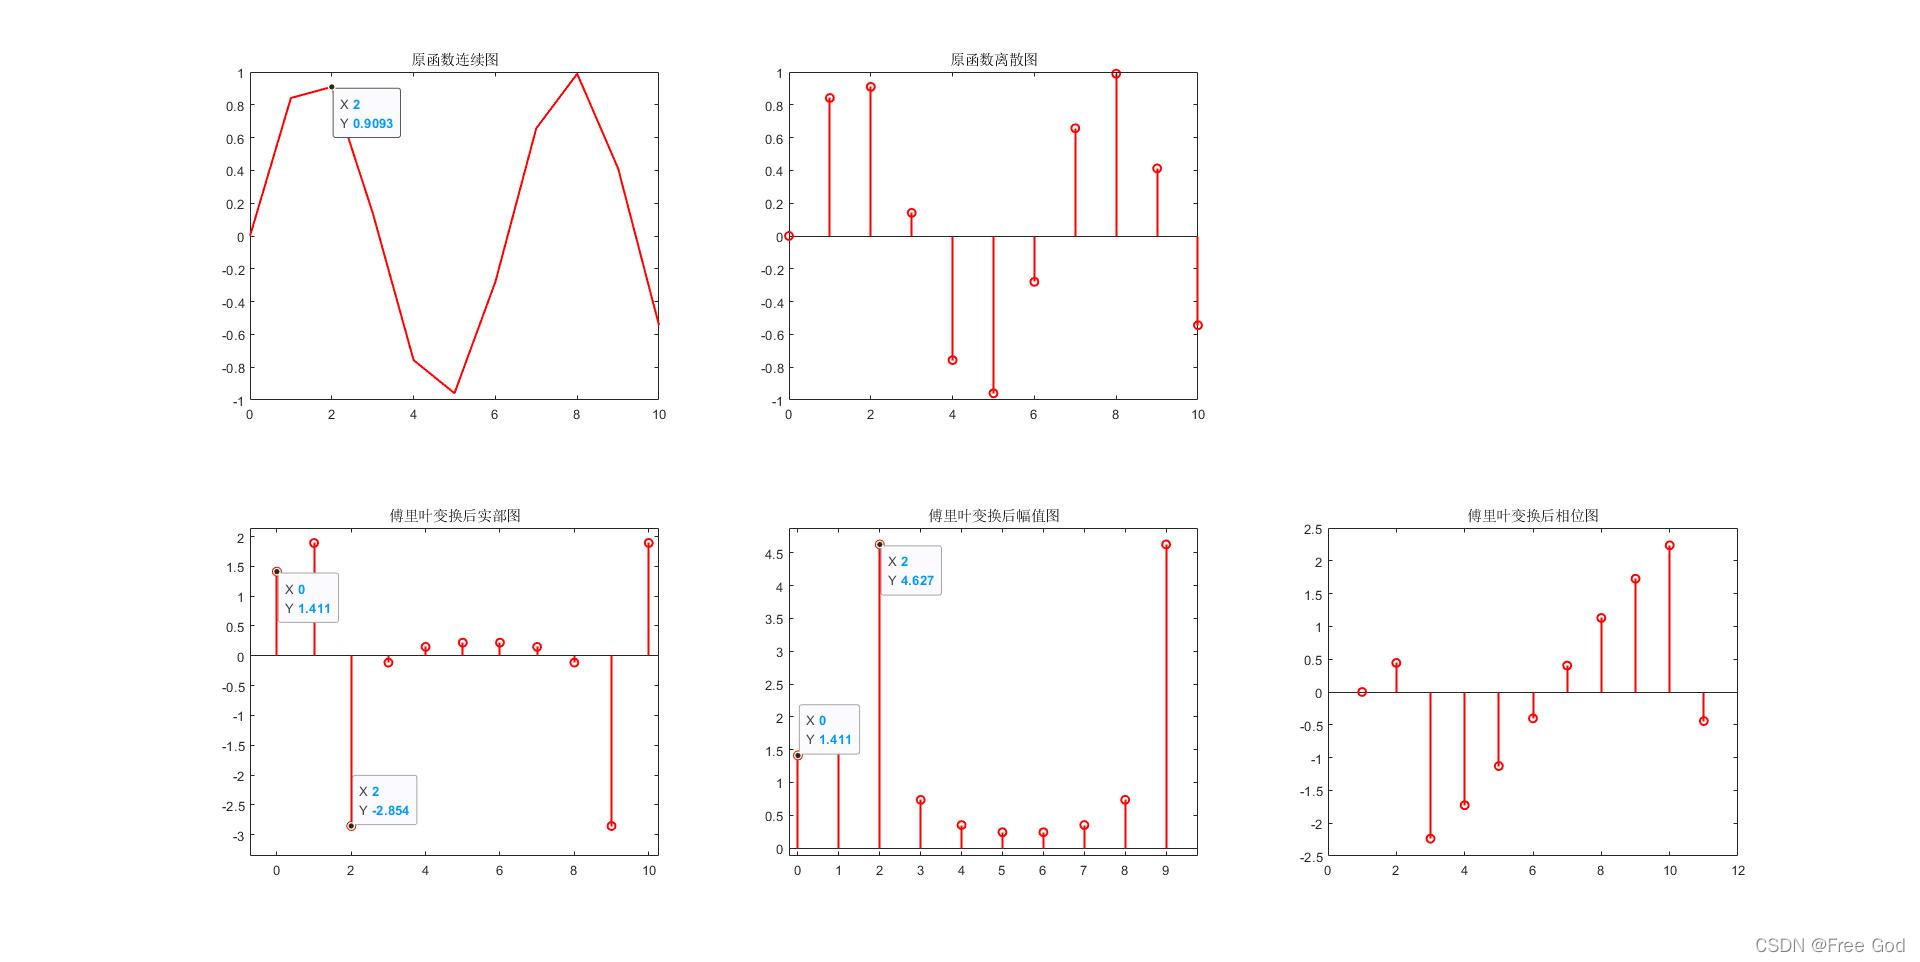
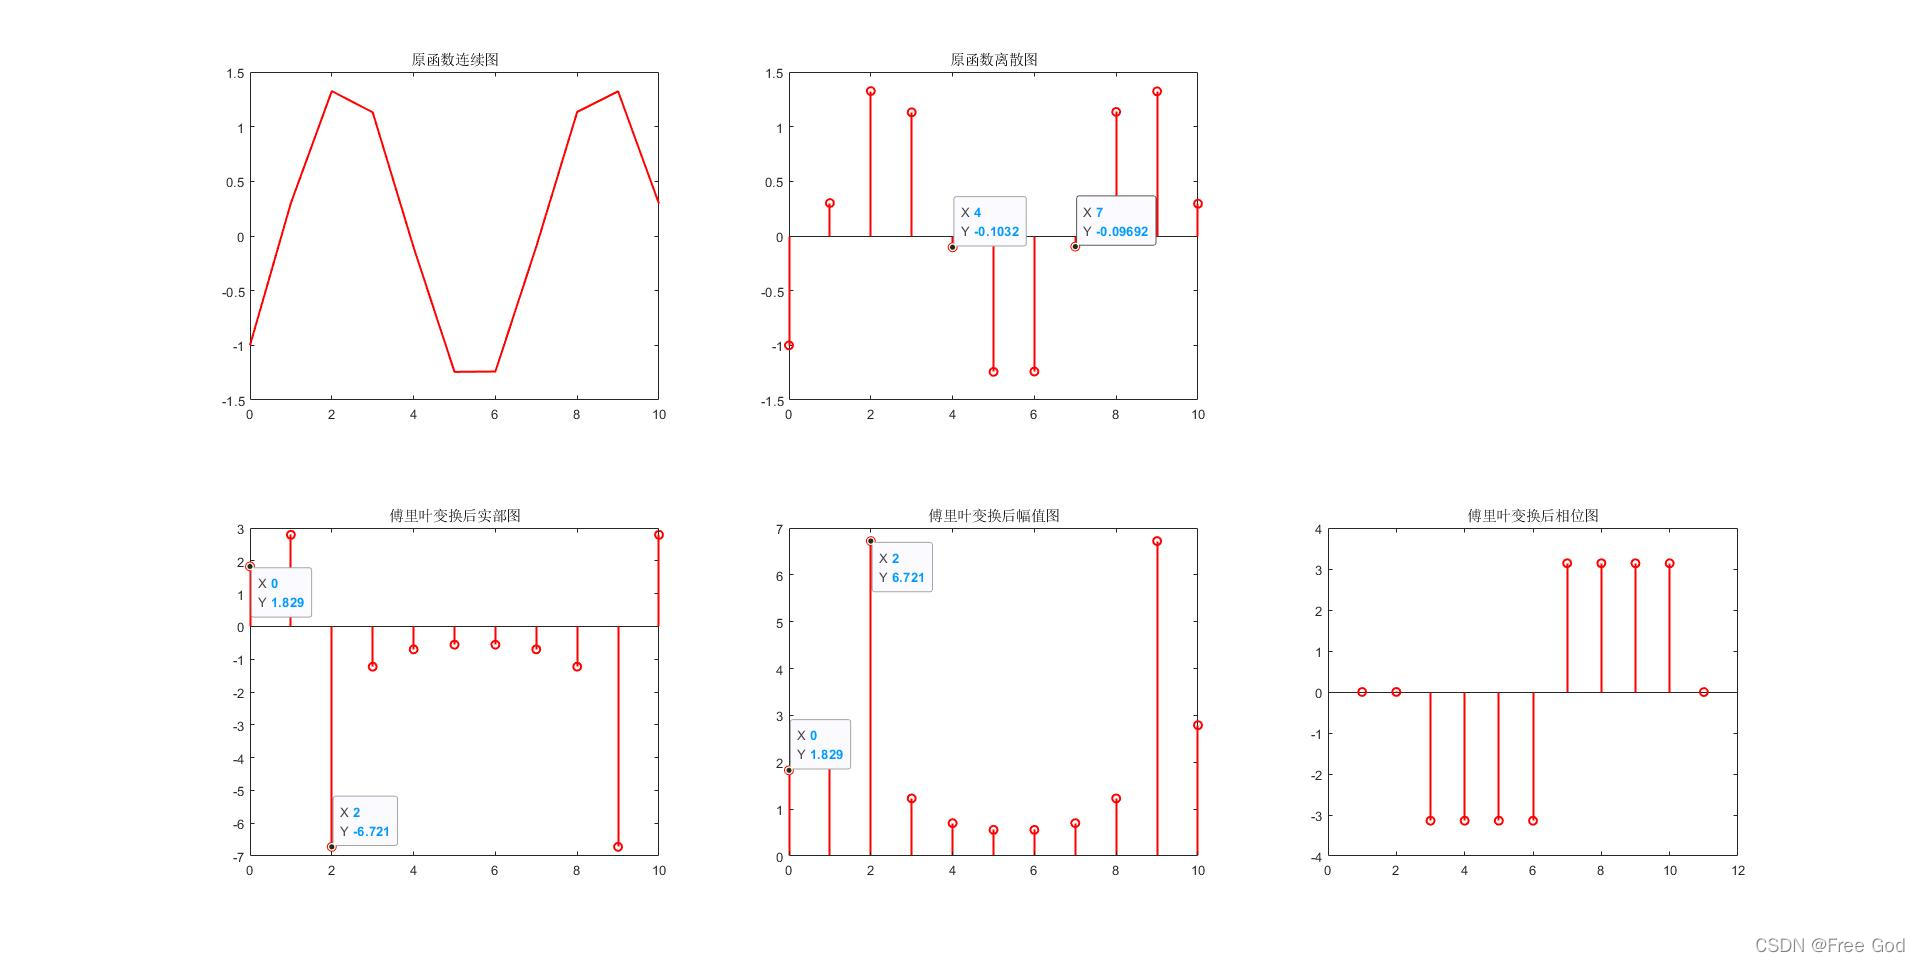
2、对 y = sin(x)进行离散傅里叶变换
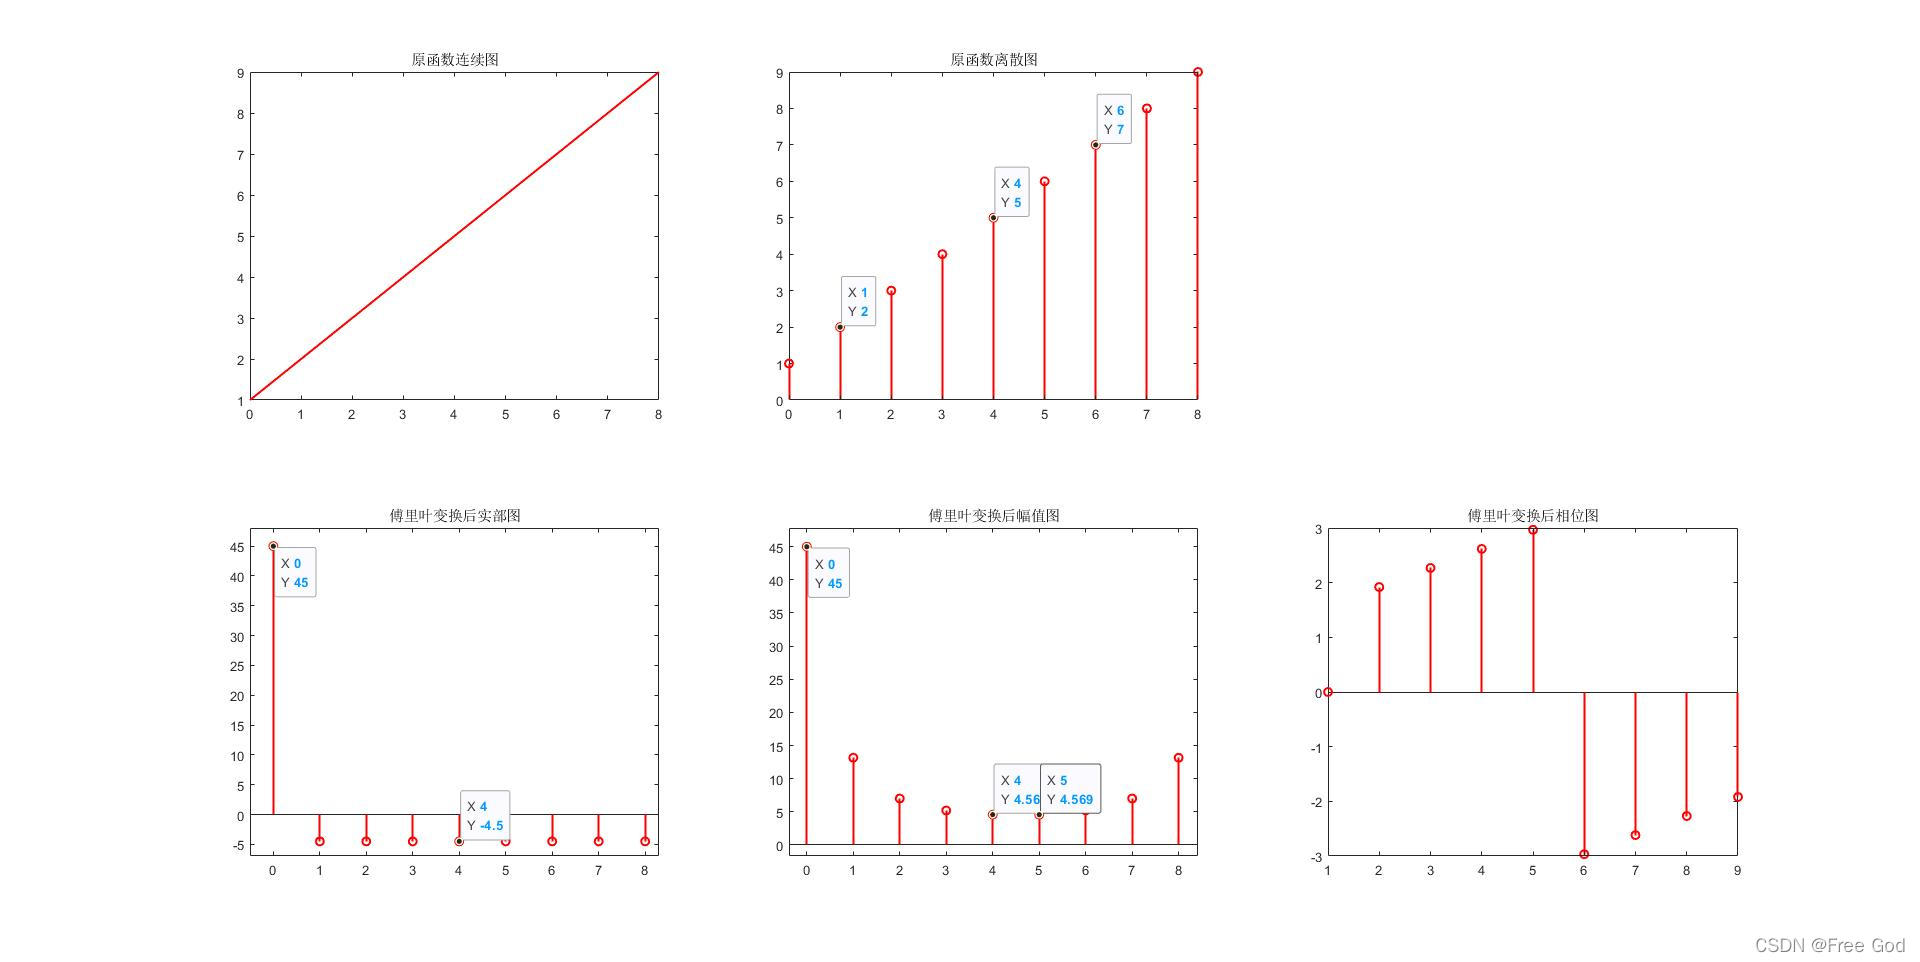
3、对 y = [1,2,4,5,6,7,8,9]进行傅里叶变换
4、对 y = sin(x)-cos(x)进行傅里叶变换
自写函数代码如下
function [fy,sumY] = Fourier2(y,dx,xLeft,xRight)
if length(y) ==1
x = xLeft:dx:xRight;
y = y(x);
fy = y;
else
x = 0:1:length(y)-1;
end
for x1 = 0:length(y)-1
temp = 0;
for x2 = 0:length(y)-1
temp = temp + y(x2+1)*exp(-1j*2*pi*x1*x2/length(y));
end
fy(x1+1) = temp;
end
sumY = sum(y(:));
figure
subFigure = 3;
subplot(2,subFigure,1),plot(x,y,"red",'LineWidth',1.5),title("原函数连续图");
subplot(2,subFigure,2),stem(x,y,"red",'LineWidth',1.5),title("原函数离散图");
subplot(2,subFigure,4),stem(x,real(fy),"red",'LineWidth',1.5),title("傅里叶变换后实部图");
subplot(2,subFigure,5),stem(x,abs(fy),"red",'LineWidth',1.5),title("傅里叶变换后幅值图");
subplot(2,subFigure,6),stem(angle(fy),"red",'LineWidth',1.5),title("傅里叶变换后相位图");
end


 1046
1046

 被折叠的 条评论
为什么被折叠?
被折叠的 条评论
为什么被折叠?
 到【灌水乐园】发言


