


今天来波大的,把图形绘制与图层全部说完,这也是我这几天的整理成果。
一、绘制点
1、添加一个点,点击点的样式改变
核心代码,该api用于修改绘制参数
map.on("click", () => {
                  map.setPaintProperty('Point', 'circle-color', '#faafee');
            })
<!DOCTYPE html>
<html lang="en">
<head>
<meta charset="UTF-8">
<meta http-equiv="X-UA-Compatible" content="IE=edge">
<meta name="viewport" content="width=device-width, initial-scale=1.0">
<title>Document</title>
<link href="https://api.mapbox.com/mapbox-gl-js/v2.12.0/mapbox-gl.css" rel="stylesheet">
<script src="https://api.mapbox.com/mapbox-gl-js/v2.12.0/mapbox-gl.js"></script>
<script src='https://lib.baomitu.com/jquery/2.2.4/jquery.js'></script>
<style>
html,
body {
overflow: hidden;
margin: 0;
}
#map {
position: absolute;
top: 0;
bottom: 0;
width: 100%;
}
</style>
</head>
<body>
<div id="map"></div>
<script>
mapboxgl.accessToken = '你的token';
const map = new mapboxgl.Map({
container: 'map', // container ID
style: 'mapbox://styles/mapbox/streets-v12', // style URL
center: [114.30, 30.50],
zoom: 12,
projection: 'globe'
});
map.on("load", function () {
map.addSource('point', {
type: 'geojson',
data: {
"type": "Feature",
"geometry": {
"type": 'Point',
"coordinates": [114.30, 30.50]
}
}
})
map.addLayer({
id: 'Point',
type: "circle",
//设置数据源
source: 'point',
//绘制参数
paint: {
'circle-opacity': 0.8,
"circle-radius": 15,
"circle-color": "#ff2d51",
"circle-stroke-width": 4,
//设置边线颜色
"circle-stroke-color": '#ffcc33',
'circle-opacity':0.5
}
})
})
map.on("click", () => {
map.setPaintProperty('Point', 'circle-color', '#faafee');
})
</script>
</body>
</html>2、添加多个点,设置图层点击事件,点击图层上的元素,元素变色
核心逻辑和代码:设置高亮图层,点击元素,将元素获取到并设置到高亮图层中
map.on("click", "Point", evt => {
                  console.log(evt.features[0])
                  let feature = e.features[0]
                 map.getSource('high_point').setData(feature)
            })
<!DOCTYPE html>
<html lang="en">
<head>
<meta charset="UTF-8">
<meta http-equiv="X-UA-Compatible" content="IE=edge">
<meta name="viewport" content="width=device-width, initial-scale=1.0">
<title>Document</title>
<link href="https://api.mapbox.com/mapbox-gl-js/v2.12.0/mapbox-gl.css" rel="stylesheet">
<script src="https://api.mapbox.com/mapbox-gl-js/v2.12.0/mapbox-gl.js"></script>
<script src='https://lib.baomitu.com/jquery/2.2.4/jquery.js'></script>
<style>
html,
body {
overflow: hidden;
margin: 0;
}
#map {
position: absolute;
top: 0;
bottom: 0;
width: 100%;
}
</style>
</head>
<body>
<div id="map"></div>
<script>
mapboxgl.accessToken = '你的token';
const map = new mapboxgl.Map({
container: 'map', // container ID
style: 'mapbox://styles/mapbox/streets-v12', // style URL
center: [114.30, 30.50],
zoom: 12,
projection: 'globe'
});
//geojson数据
const data = {
type: "FeatureCollection",
features: [
{
"type": "Feature",
"geometry": {
"type": 'Point',
"coordinates": [114.30, 30.50]
},
properties: {
id: 1001,
name: "武昌"
}
},
{
"type": "Feature",
"geometry": {
"type": 'Point',
"coordinates": [114.30, 30.520]
},
properties: {
id: 1001,
name: "蔡甸"
}
}
]
}
map.on("load", function () {
map.addSource('point', {
generateId: true,
type: 'geojson',
data
})
map.addLayer({
id: 'Point',
type: "circle",
//设置数据源
source: 'point',
//绘制参数
paint: {
'circle-opacity': 0.8,
"circle-radius": 18,
"circle-color": "#ff2d51",
"circle-stroke-width": 4,
//设置边线颜色
"circle-stroke-color": '#ffcc33'
}
})
//临时高亮图层
map.addSource('high_point', {
generateId: true,
type: 'geojson',
data:{
type: 'FeatureCollection',
features: []
}
})
map.addLayer({
id: 'high_Point',
type: "circle",
//设置数据源
source: 'high_point',
//绘制参数
paint: {
'circle-opacity': 0.8,
"circle-radius": 18,
"circle-color": "red",
"circle-stroke-width": 4,
//设置边线颜色
"circle-stroke-color": '#ffcc33'
}
})
})
map.on("click", "Point", evt => {
console.log(evt.features[0])
let feature = e.features[0]
map.getSource('high_point').setData(feature)
})
</script>
</body>
</html>3、设置鼠标形状
类似mouseenter这周api可以去mapbox官网查询
map.on("load", function () {
  map.on('mouseenter', 'Point', () => {
    map.getCanvas().style.cursor = 'pointer';
  });

  // Change the cursor back to a pointer
  // when it leaves the states layer.
  map.on('mouseleave', 'Point', () => {
    map.getCanvas().style.cursor = 'default';
  });

})
4、点击事件改变元素位置
核心思路:点击获取坐标,把点击获取的坐标替换掉原来的坐标
map.on("click", (evt) => {
  // console.log(evt.lngLat)
  let { lng, lat } = evt.lngLat;
  let feature = {
    type:"Feature",
    geometry:{
      type:"Point",
      coordinates:[lng,lat]
    }
  }
  map.getSource("point").setData(feature);
})
二、绘制线
1、实线
map.on("load", () => {
  addLine();
})
function addLine() {
  //用geojson创建一条线
  var geometryLine = {
    "type": "Feature",
    "geometry": {
      "type": "LineString",
      "coordinates": [[114.30, 30.50], [116, 30.50]]
    }
  };
  //将线添加到一个图层中,在地图中显示
  map.addLayer({
    //此id可随意设置,但是要唯一
    "id": "Line",
    //指定类型为线
    "type": "line",
    //设置数据来源
    "source": {
      "type": "geojson",
      "data": geometryLine
    },
    //设置绘制参数
    "paint": {
      //设置线颜色
      "line-color": "#1990FF",
      //设置线宽度,像素单位
      "line-width": 4,
      'line-opacity': 0.6
    }
  });
}
2、虚线
<!DOCTYPE html>
  <html>

  <head>
  <meta charset="utf-8">
  <title>Add an ant path animation to a line</title>
  <meta name="viewport" content="initial-scale=1,maximum-scale=1,user-scalable=no">
  <link href="https://api.mapbox.com/mapbox-gl-js/v2.12.0/mapbox-gl.css" rel="stylesheet">
  <script src="https://api.mapbox.com/mapbox-gl-js/v2.12.0/mapbox-gl.js"></script>
  <style>
  body {
  margin: 0;
  padding: 0;
}

#map {
  position: absolute;
  top: 0;
  bottom: 0;
  width: 100%;
}
</style>
  </head>

  <body>
  <div id="map"></div>
  <script>
  mapboxgl.accessToken = '你的token';
const map = new mapboxgl.Map({
  container: 'map', // container ID
  // Choose from Mapbox's core styles, or make your own style with Mapbox Studio
  style: 'mapbox://styles/mapbox/dark-v11', // style URL
  center: [-73.9709, 40.6712], // starting position [lng, lat]
  zoom: 15.773 // starting zoom
});

const geojson = {
  'type': 'FeatureCollection',
  'features': [
    {
      'type': 'Feature',
      'properties': {},
      'geometry': {
        'coordinates': [
          [-73.97003, 40.67264],
          [-73.96985, 40.67235],
          [-73.96974, 40.67191],
          [-73.96972, 40.67175],
          [-73.96975, 40.67154],
          [-73.96987, 40.67134],
          [-73.97015, 40.67117],
          [-73.97045, 40.67098],
          [-73.97064, 40.67078],
          [-73.97091, 40.67038],
          [-73.97107, 40.67011],
          [-73.97121, 40.66994],
          [-73.97149, 40.66969],
          [-73.97169, 40.66985],
          [-73.97175, 40.66994],
          [-73.97191, 40.66998],
          [-73.97206, 40.66998],
          [-73.97228, 40.67008]
        ],
        'type': 'LineString'
      }
    }
  ]
};

map.on('load', () => {
  map.addSource('line', {
    type: 'geojson',
    data: geojson
  });

  // add a line layer with line-dasharray set to the first value in dashArraySequence
  map.addLayer({
    type: 'line',
    source: 'line',
    id: 'line-dashed',
    paint: {
      'line-color': 'yellow',
      'line-width': 6,
//该属性会将实线打断为虚线
      'line-dasharray': [0,3,1]
    }
  });
});
</script>

  </body>

  </html>
3、点击事件连线
核心思路:就是通过点击事件不断获取新的点坐标,将点坐标push到coordinates中
var geometryLine = {
  "type": "Feature",
  "geometry": {
    "type": "LineString",
    "coordinates": [[114.30, 30.50], [114.4, 30.50]]
  }
};
map.on("style.load", () => {
  map.addSource("line-source", {
    "type": "geojson",
    "data": geometryLine
  })
  //将线添加到一个图层中,在地图中显示
  map.addLayer({
    //此id可随意设置,但是要唯一
    "id": "Line",
    //指定类型为线
    "type": "line",
    //设置数据来源
    "source": "line-source",
    //设置绘制参数
    "paint": {
      //设置线颜色
      "line-color": "#1990FF",
      //设置线宽度,像素单位
      "line-width": 4,
      'line-opacity': 0.6
    }
  });
})
map.on("click", (evt) => {
  // console.log(evt.lngLat)
  let { lng, lat } = evt.lngLat;
  geometryLine.geometry.coordinates.push([lng, lat]);
  // console.log(geometryLine);
  map.getSource("line-source").setData(geometryLine)
})
三、绘制圆
通过点画圆
function addCircle() {
//用geojson创建一个点
var geometryCircle = {
"type": "Feature",
"geometry": {
"type": "Point",
"coordinates": [114, 30]
}
};
//将圆添加到一个图层中,在地图中显示
map.addLayer({
//此id可随意设置,但是要唯一
"id": "Circle",
//指定类型为circle(圆)
"type": "circle",
//设置数据来源
"source": {
"type": "geojson",
"data": geometryCircle
},
//设置绘制参数
"paint": {
//设置点的半径,像素单位
"circle-radius": 30,
//设置点的填充颜色
"circle-color": 'white',
//设置边线宽度,像素单位
"circle-stroke-width": 2,
//设置边线颜色
"circle-stroke-color": '#ffcc33'
}
});
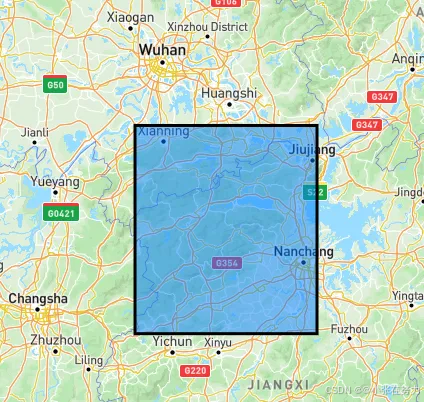
}四、绘制矩形
<!DOCTYPE html>
<html lang="en">

<head>
    <meta charset="UTF-8">
    <meta http-equiv="X-UA-Compatible" content="IE=edge">
    <meta name="viewport" content="width=device-width, initial-scale=1.0">
    <title>Document</title>
    <!-- 1、导入mapbox的依赖 js+css -->
    <script src='https://api.mapbox.com/mapbox-gl-js/v2.12.0/mapbox-gl.js'></script>
    <link href='https://api.mapbox.com/mapbox-gl-js/v2.12.0/mapbox-gl.css' rel='stylesheet' />
    <style>
        * {
            margin: 0;
            padding: 0
        }

        #map {
            width: 100vw;
            height: 100vh;
        }
    </style>
</head>

<body>
    <!-- 2、设置地图容器的挂载点 -->
    <div id="map">

    </div>
    <script>
        /* 3、实例化地图 */
        mapboxgl.accessToken = '你的token';
        const map = new mapboxgl.Map({
            /* 将地图挂载到对应的DOM上 相当于ol的target */
            container: "map",
            /* 相当于ol的layers */
            style: "mapbox://styles/mapbox/streets-v12",
            center: [114.30, 30.50],
            zoom: 6
        })

        var data = {
            type: "Feature",
            geometry: {
                type: "Polygon",
                coordinates: [
                    [
                        [114.30, 30.50], [116, 30.50],
                        [116, 28], [114.30, 28], [114.30, 30.50]
                    ]
                ]
            }
        }
        map.on("style.load", () => {

            //填充
            map.addLayer({
                id:"box-fill",
                type:"fill",
                source:{
                    type:"geojson",
                    data
                },
                paint:{
                    'fill-color':"red",
                    'fill-opacity':0.5
                }
            })
            /* 描边 line */
            map.addLayer({
                id:"box-stroke",
                type:"line",
                source:{
                    type:"geojson",
                    data
                },
                paint:{
                    'line-color':"#333",
                    'line-width':3
                }
            })

        })
    </script>
</body>

</html>
五、添加多边形
方式一不带描边
function addPolygon() {
  //用geojson创建一个多边形
  var geometryPolygon = {
    type: "FeatureCollection",
    features: [
      {
        type: "Feature",
        geometry: {
          type: "Polygon",
          coordinates: [
            [
              [100, 40],
              [110, 40],
              [115, 35],
              [110, 30],
              [100, 30],
              [95, 35],
            ],
          ],
        },
      },
    ],
  };
  //将多边形添加到一个图层中,在地图中显示
  map.addLayer({
    //此id可随意设置,但是要唯一
    id: "Polygon",
    //指定类型为fill(填充区域)
    type: "fill",
    //设置数据来源
    source: {
      type: "geojson",
      data: geometryPolygon,
    },
    //设置绘制参数
    paint: {
      //设置填充颜色
      "fill-color": "#ffcc33",
      //设置透明度
      "fill-opacity": 0.9,
    },
  });
}
方式二带描边
map.addSource("maine", {
  type: "geojson",
  data: {
    type: "Feature",
    geometry: {
      type: "Polygon",
      // These coordinates outline Maine.
      coordinates: [
        [
          [114, 30],
          [114, 20],
          [130, 20],
          [130, 30],
          [114, 30]
        ],
      ],
    },
  },
});

// Add a new layer to visualize the polygon.
map.addLayer({
  id: "maine",
  type: "fill",
  source: "maine", // reference the data source
  layout: {},
  paint: {
    "fill-color": "#0080ff", // blue color fill
    "fill-opacity": 0.5,
  },
});
// Add a black outline around the polygon.
map.addLayer({
  id: "outline",
  type: "line",
  source: "maine",
  layout: {},
  paint: {
    "line-color": "#000",
    "line-width": 3,
  },
});


 1292
1292

 被折叠的 条评论
为什么被折叠?
被折叠的 条评论
为什么被折叠?
 到【灌水乐园】发言


