


服务雪崩效应
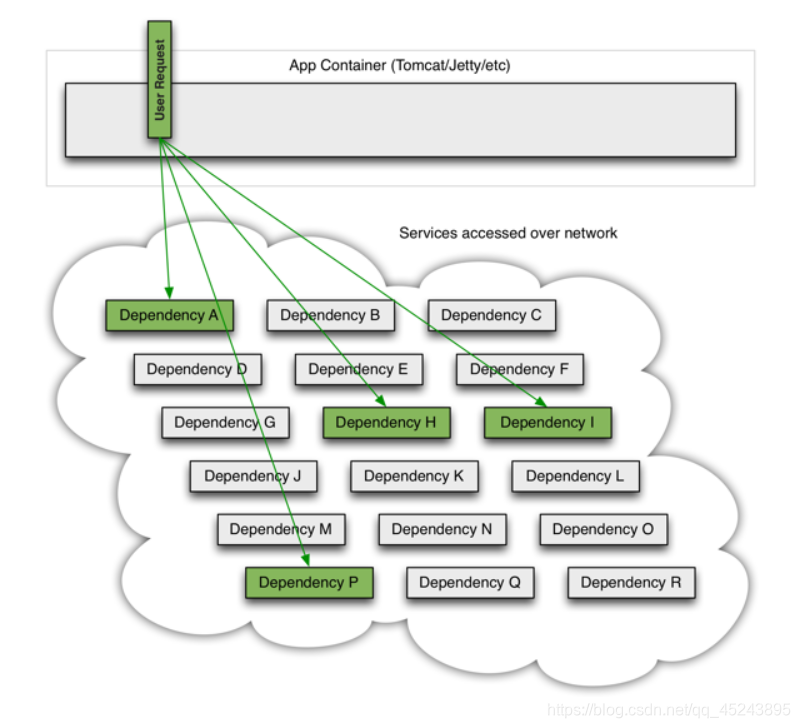
当一个请求依赖多个服务的时候:
正常情况下的访问 ,如下图:
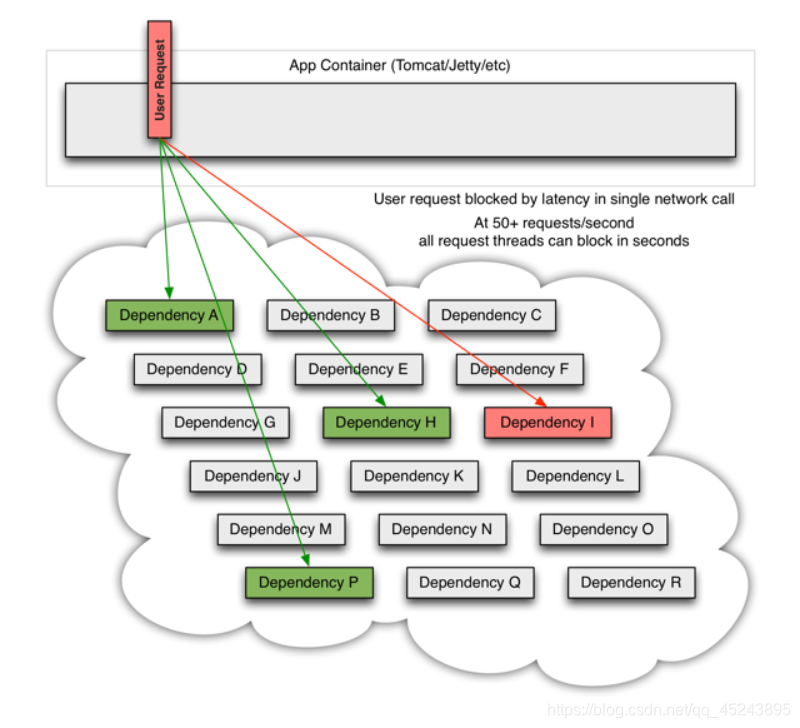
但是,当请求的服务中出现无法访问、异常、超时等问题时,那么用户的请求将会被阻塞,如下图:
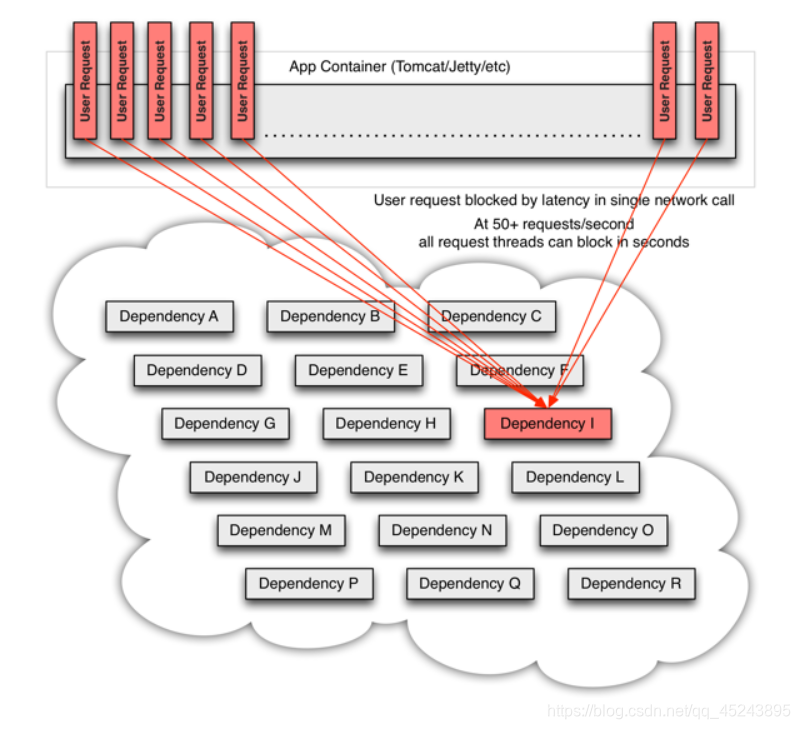
如果多个用户的请求中,都存在无法访问的服务,那么他们都将陷入阻塞的状态中,如下图:
Hystrix的引入,可以通过服务熔断和服务降级来解决这个问题
服务熔断服务降级
简介
hystrix对应的中文名字是“豪猪”,豪猪周身长满了刺,能保护自己不受天敌的伤害,代表了一种防御机制,这与hystrix本身的功能不谋而合,因此Netflix团队将该框架命名为Hystrix,并使用了对应的卡通形象做作为logo。

在一个分布式系统里,许多依赖不可避免的会调用失败,比如超时、异常等,如何能够保证在一个依赖出问题的情况下,不会导致整体服务失败,这个就是Hystrix需要做的事情。Hystrix提供了熔断、隔离、Fallback、cache、监控等功能,能够在一个、或多个依赖同时出现问题时保证系统依然可用。
Hystrix服务熔断服务降级@HystrixCommand fallbackMethod
熔断机制是应对雪崩效应的一种微服务链路保护机制。
当某个服务不可用或者响应时间超时,会进行服务降级,进而熔断该节点的服务调用,快速返回自定义的错误影响页面信息。
测试hystrix
我们写一个新的带服务熔断的服务提供者项目 microservice-student-provider-hystrix-1004

把原来的服务提供者项目 配置和 代码 都复制一份到这个项目里;
然后修改。
添加pom.xml
<!--Hystrix相关依赖-->
<dependency>
    <groupId>org.springframework.cloud</groupId>
    <artifactId>spring-cloud-starter-hystrix</artifactId>
</dependency>
application.yml修改下端口和实例名称
server:
  port: 1004
  context-path: /
spring:
  datasource:
    type: com.alibaba.druid.pool.DruidDataSource
    driver-class-name: com.mysql.jdbc.Driver
    url: jdbc:mysql://localhost:3306/test?useUnicode=true&characterEncoding=utf8
    username: root
    password: 123
  jpa:
    hibernate:
      ddl-auto: update
    show-sql: true
  application:
    name: microservice-student
  profiles: provider-hystrix-1004

eureka:
  instance:
    hostname: localhost
    appname: microservice-student
    instance-id: microservice-student:1004
    prefer-ip-address: true
  client:
    service-url:
      defaultZone: http://eureka2001.zxp.com:2001/eureka/,http://eureka2002.zxp.com:2002/eureka/,http://eureka2003.zxp.com:2003/eureka/

info:
  groupId: com.zxp.testSpringcloud
  artifactId: microservice-student-provider-hystrix-1004
  version: 1.0-SNAPSHOT
  userName: http://zxp.com
  phone: 123456
启动类StudentProviderHystrixApplication_1004加下注解支持 @EnableCircuitBreaker
package com.zxp.microservicestudentproviderhystrix1004;

import org.springframework.boot.SpringApplication;
import org.springframework.boot.autoconfigure.SpringBootApplication;
import org.springframework.boot.autoconfigure.domain.EntityScan;
import org.springframework.cloud.client.circuitbreaker.EnableCircuitBreaker;
import org.springframework.cloud.netflix.eureka.EnableEurekaClient;

@EnableCircuitBreaker
@EntityScan("com.zxp.*.*")
@EnableEurekaClient
@SpringBootApplication
public class MicroserviceStudentProviderHystrix1004Application {

    public static void main(String[] args) {
        SpringApplication.run(MicroserviceStudentProviderHystrix1004Application.class, args);
    }

}
服务提供者1004中controller新增方法
/**
     * 测试Hystrix服务降级
     * @return
     * @throws InterruptedException
     */
    @ResponseBody
    @GetMapping(value="/hystrix")
    @HystrixCommand(fallbackMethod="hystrixFallback")
    public Map<String,Object> hystrix() throws InterruptedException{
//        Thread.sleep(1100);
        Map<String,Object> map=new HashMap<String,Object>();
        map.put("code", 200);
        map.put("info","工号【"+port+"】正在为您服务");
        return map;
    }

    public Map<String,Object> hystrixFallback() throws InterruptedException{
        Map<String,Object> map=new HashMap<String,Object>();
        map.put("code", 500);
        map.put("info", "系统【"+port+"】繁忙,稍后重试");
        return map;
    }
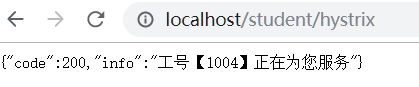
这里我正常访问 返回的是 200 业务数据xxxxx
但是我们这里Thread.sleep(1100) 模拟超时;
这里的话 我们加上@HystrixCommand注解 以及 fallbackMethod
表明这个方法我们再 没有异常以及没有超时(hystrix默认1秒算超时)的情况,才返回正常的业务数据;
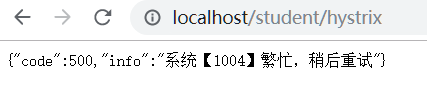
否则,进入我们fallback指定的本地方法,我们搞的是500 系统出错,稍后重试,有效的解决雪崩效应,以及返回给用户界面
很好的报错提示信息;
microservice-student-consumer-80项目也要对应的加个方法
 /**
     * 测试Hystrix服务降级
     * @return
     */
    @GetMapping(value="/hystrix")
    @ResponseBody
    public Map<String,Object> hystrix(){
        return restTemplate.getForObject(SERVER_IP_PORT+"/student/hystrix/", Map.class);
    }
测试hystrix
先启动三个eureka,再启动带hystrix的provider,最后启动普通的consumer;
浏览器:http://localhost/student/hystrix
关闭模拟超时
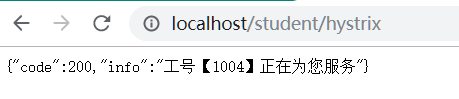
开启模拟超时
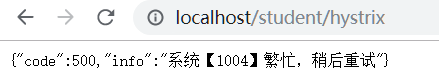
因为 Hystrix默认1算超时,所有 sleep了1.1秒 所以进入自定义fallback方法,防止服务雪崩;但是这样太苛刻了,接下来演示修改Hystrix默认超时时间设置。
Hystrix默认超时时间设置
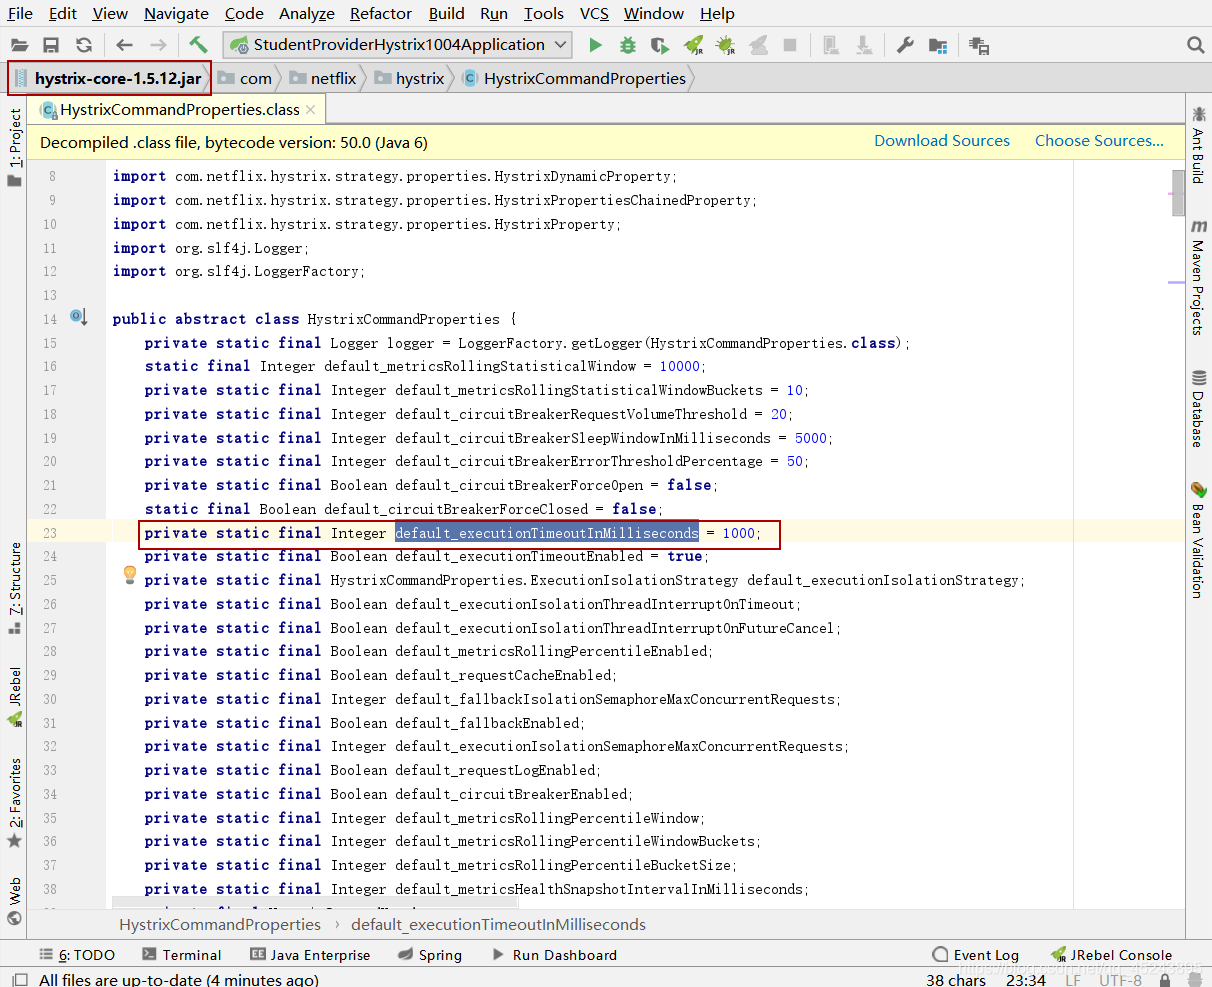
Hystrix默认超时时间是1秒,我们可以通过hystrix源码看到,
找到 hystrix-core.jar com.netflix.hystrix包下的HystrixCommandProperties类
default_executionTimeoutInMilliseconds属性局势默认的超时时间
我们系统里假如要自定义设置hystrix的默认时间的话,application.yml配置文件加上
hystrix:
  command:
    default:
      execution:
        isolation:
          thread:
            timeoutInMilliseconds: 3000
####### 测试自定义设置hystrix的默认时间
自定义配置改成3秒 然后 我们代码里sleep修改成2秒测试;
sleep修改成4秒;
演示完成
Hystrix服务监控Dashboard
Hystrix服务监控Dashboard仪表盘
Hystrix提供了 准实时的服务调用监控项目Dashboard,能够实时记录通过Hystrix发起的请求执行情况,
可以通过图表的形式展现给用户看。
简单使用
我们新建项目:microservice-student-consumer-hystrix-dashboard-90

加依赖:
<!--Hystrix服务监控Dashboard依赖-->
<dependency>
    <groupId>org.springframework.cloud</groupId>
    <artifactId>spring-cloud-starter-hystrix</artifactId>
</dependency>
<dependency>
    <groupId>org.springframework.cloud</groupId>
    <artifactId>spring-cloud-starter-hystrix-dashboard</artifactId>
</dependency>
<dependency>
    <groupId>org.springframework.boot</groupId>
    <artifactId>spring-boot-starter-actuator</artifactId>
</dependency>
application.yml配置
server:
  port: 90
  context-path: /
启动类:StudentConsumerDashBoardApplication_90加注解:@EnableHystrixDashboard
package com.zxp.microservicestudentconsumerhystrixdashboard90;

import org.springframework.boot.SpringApplication;
import org.springframework.boot.autoconfigure.SpringBootApplication;
import org.springframework.boot.autoconfigure.jdbc.DataSourceAutoConfiguration;
import org.springframework.boot.autoconfigure.orm.jpa.HibernateJpaAutoConfiguration;
import org.springframework.cloud.netflix.hystrix.dashboard.EnableHystrixDashboard;

@SpringBootApplication(exclude={DataSourceAutoConfiguration.class, HibernateJpaAutoConfiguration.class})
@EnableHystrixDashboard
public class MicroserviceStudentConsumerHystrixDashboard90Application {

    public static void main(String[] args) {
        SpringApplication.run(MicroserviceStudentConsumerHystrixDashboard90Application.class, args);
    }

}
测试
我们启动这个项目然后浏览器输入:http://localhost:90/hystrix
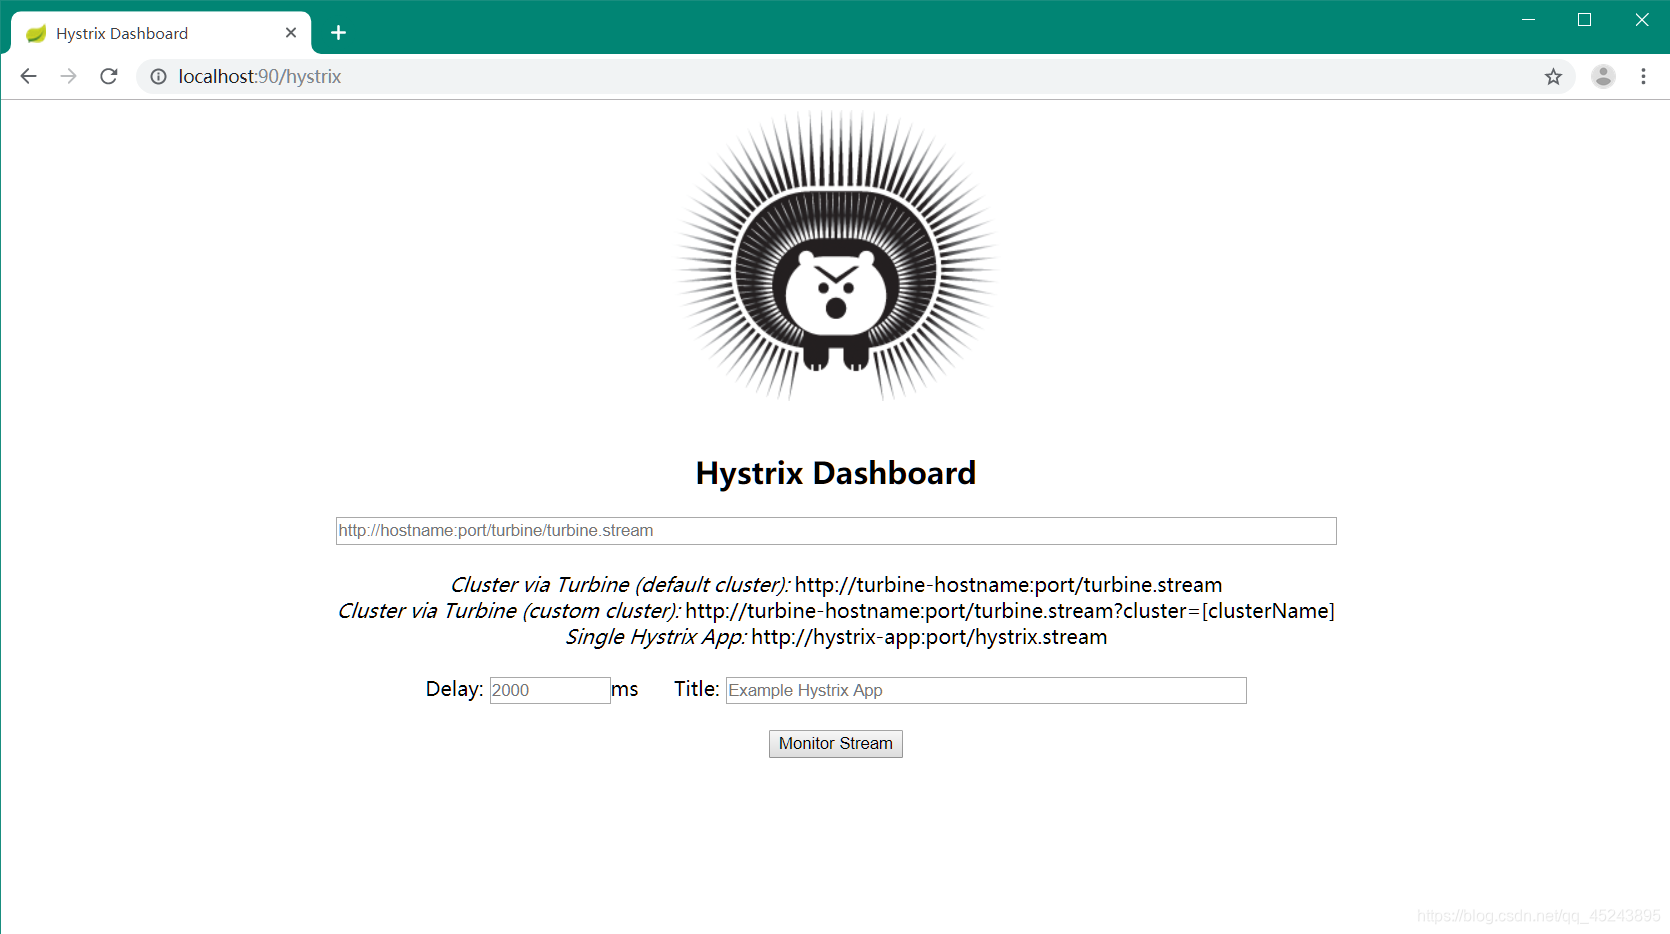
出现这个 就说明Hystrix服务监控Dashboard配置成功;
然后启动三个eureka,然后再启动microservice-student-provider-hystrix-1004
我们直接请求http://localhost:1004/student/hystrix
返回正常业务
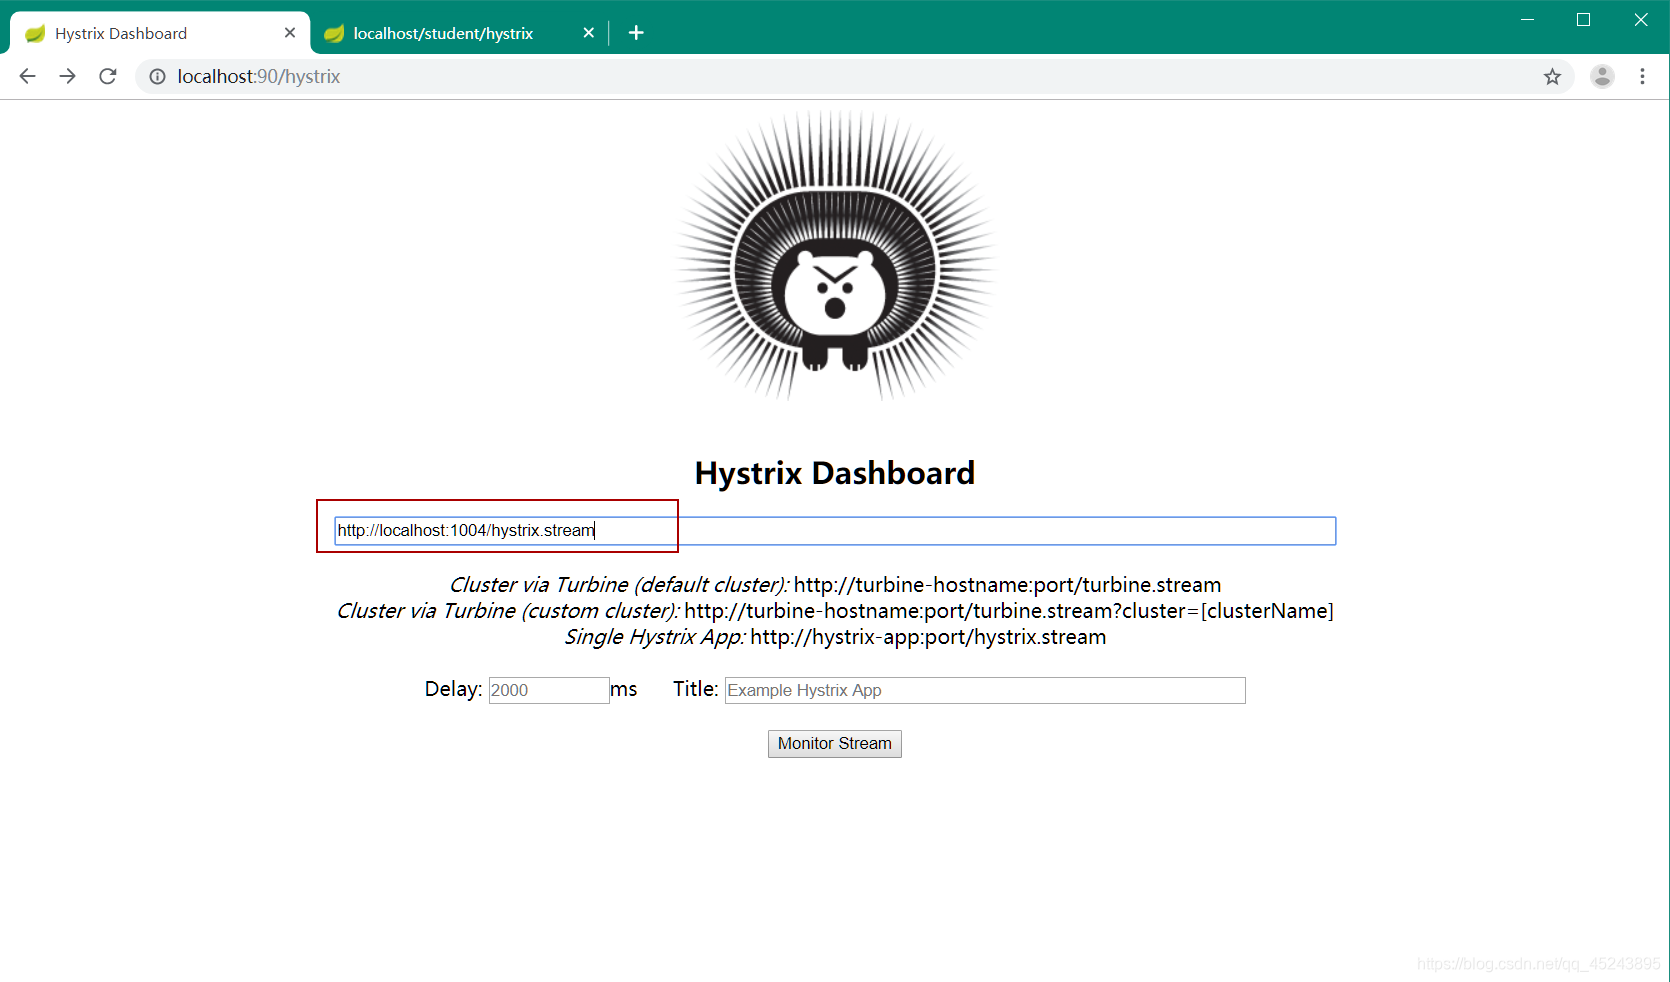
我们监控的话,http://localhost:1004/hystrix.stream 这个路径即可;
一直是ping,然后data返回数据;
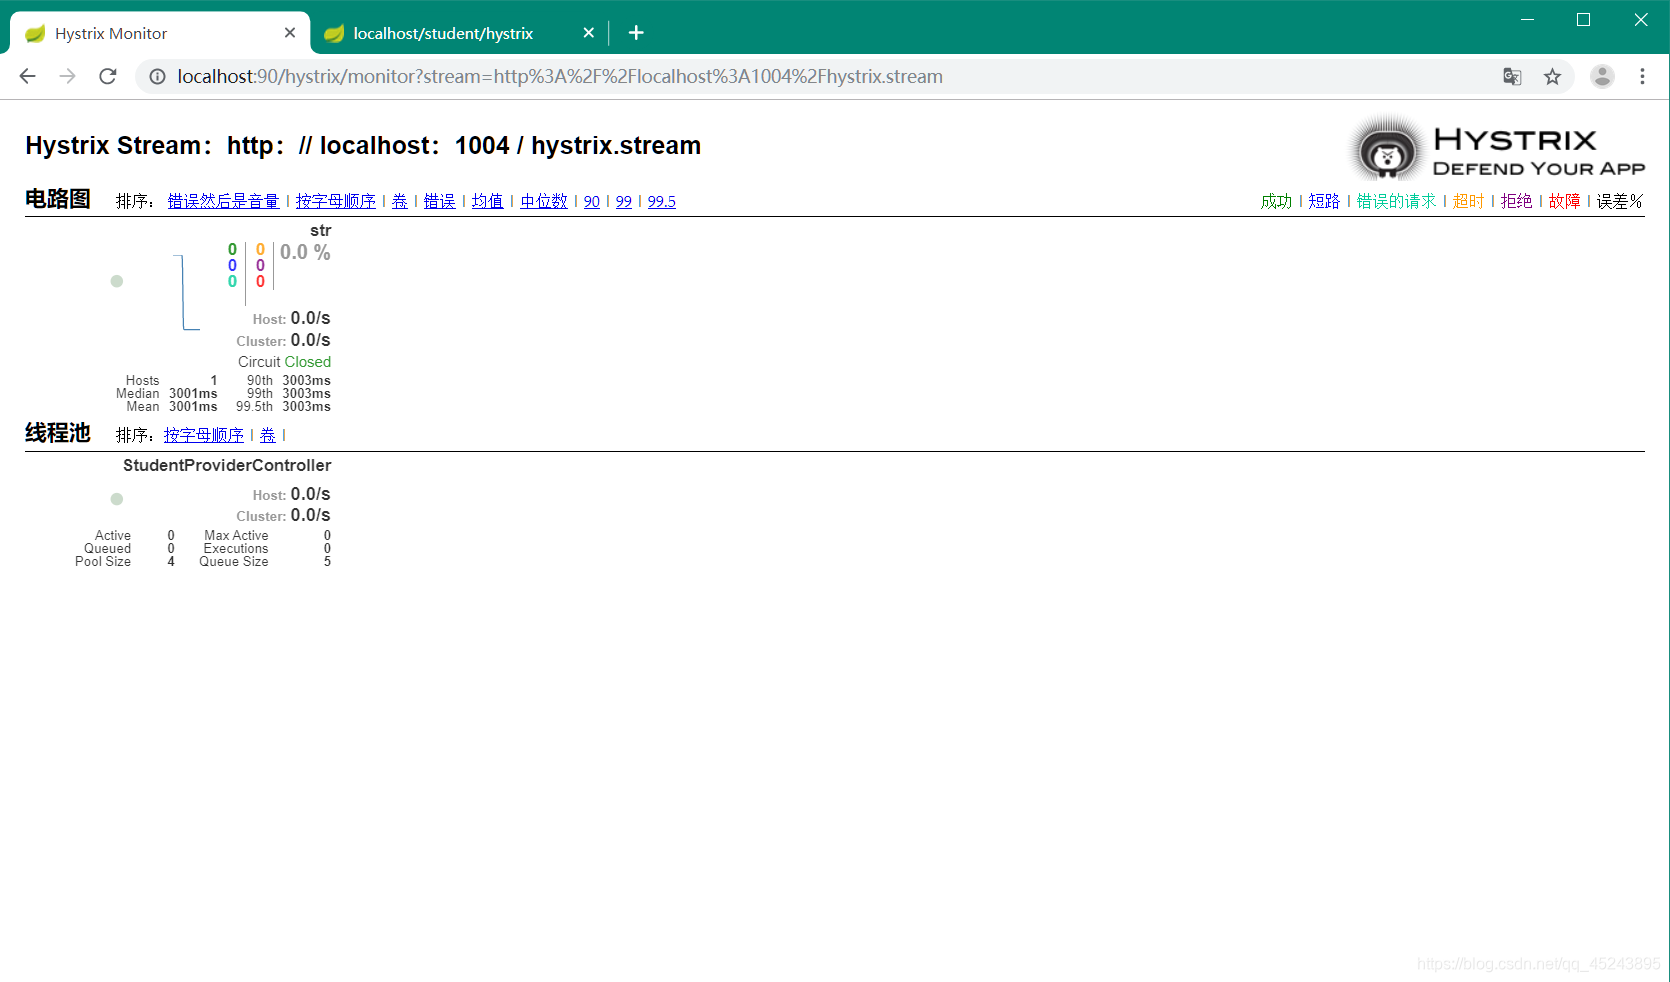
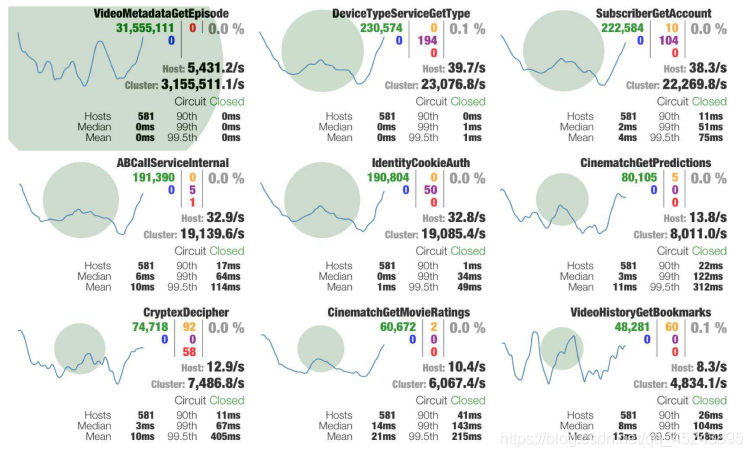
用图形化的话
指标含义:
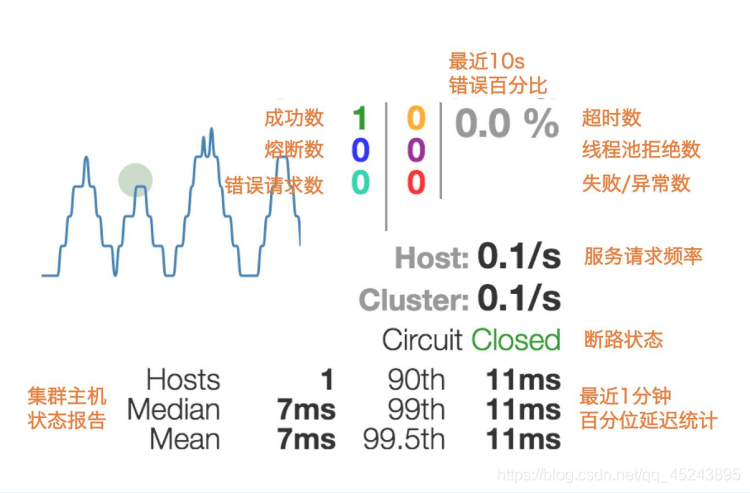
各种情况:


 292
292

 被折叠的 条评论
为什么被折叠?
被折叠的 条评论
为什么被折叠?
 到【灌水乐园】发言


