


先看下样式。
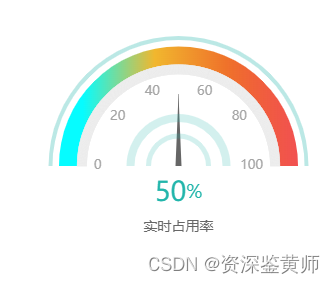
这里也是参照大佬的配置 Echarts仪表盘配置(纯净半圆环版)-优快云博客 来稍微修改的。感谢大佬
话不多说,直接上代码。
文件 getOptions.js 内容,这里把配置单独写了一个js文件。
import * as echarts from 'echarts'

const angleConfig = {
  center: ['50%', '60%'],
  startAngle: 180,
  endAngle: 0
}

const commonConfig = {
  splitLine: {
    show: false
  },
  // splitLine: {
  //   show: false
  // },
  axisLabel: {
    show: false
  },
  axisTick: {
    show: false
  },
  pointer: {
    show: false
  },
  detail: {
    show: false
  }
}

export const getGuageOptions = (value) => {
  const w = window.innerWidth

  const titleSize = w > 1280 ? 27 : 20
  const unitSize = w > 1280 ? 18 : 14

  const data = [{
    value
  }]
  const option = {
    series: [
      // 这个是数据半圆
      {
        name: '数据层',
        type: 'gauge',
        // 外层渐变加刻度修改大小  如改这个配置   请同步修改内圈及指针
        radius: '92%',
        // 最大最小值
        min: 0,
        max: 100,

        ...commonConfig,
        ...angleConfig,

        // 刻度分割比例
        splitNumber: 5,

        // 设置外侧背景色
        axisLine: {
          show: true,
          //  圆角
          roundCap: false,
          lineStyle: {
            width: 18,
            // 颜色渐变
            color: [
              [
                1,
                new echarts.graphic.LinearGradient(0, 0, 1, 0, [
                  {
                    offset: 0.1,
                    color: 'rgba(6, 252, 255, 1)'
                  },
                  {
                    offset: 0.4,
                    color: 'rgba(241, 183, 46, 1)'
                  },
                  {
                    offset: 0.7,
                    color: 'rgba(239, 114, 42, 1)'
                  },
                  {
                    offset: 1,
                    color: 'rgba(238, 38, 38, .8)'
                  }
                ])
              ]
            ]
          }
        },

        // 修改刻度线样式(数据半圆下边的 灰色半圆)
        axisTick: {
          show: true,
          splitNumber: 100,
          // 刻度长度(宽)
          length: 10,
          // 距离渐变色圈的位置比
          distance: 0,
          //  变成粉色背景 透明度越高, 刻度线就不会显示出来
          lineStyle: {
            color: '#EAEAEA',
            opacity: 0.8
          }
        },

        // 刻度文字 配置
        axisLabel: {
          // 距离渐变色圈的位置比
          distance: 15,
          fontSize: 13,
          color: '#A4A4A4'
        },
        // 指针配置
        pointer: {
          // 指针长度
          // length: '55',
          // 指针形状
          icon: 'triangle',
          width: 6,
          // 指针位置 5.0.1 支持
          offsetCenter: [0, 0],
          // 指针样式配置对象
          itemStyle: {
            color: '#666666'
          }
        },
        // 中间文字配置
        detail: {
          formatter: [`{value|${value}}`, '{unit|%}'].join(''),
          rich: {
            value: {
              fontSize: titleSize,
              color: '#22b5ab'
            },
            unit: {
              fontSize: unitSize,
              color: '#22b5ab'
            }
          },
          offsetCenter: ['0%', '23%']
        },
        data
      },
      // 最外层细线半圆
      {
        name: '外层',
        type: 'gauge',
        // 外层修改 这个需同步修改
        radius: '100%',

        ...commonConfig,
        ...angleConfig,

        // 线的修改
        axisLine: {
          show: true,
          lineStyle: {
            color: [[1, '#BBE8E5']],
            // 宽度  指针覆盖的那个
            width: 4,
            opacity: 1
          }
        },
        data
      },
      // 内2层半圆
      {
        name: '内层2',
        type: 'gauge',
        // 外层修改 这个需同步修改
        radius: '40%',

        ...commonConfig,
        ...angleConfig,

        // 线的修改
        axisLine: {
          show: true,
          lineStyle: {
            color: [[1, 'rgba(34, 181, 171, .2)']],
            // 宽度  指针覆盖的那个
            width: 8,
            opacity: 1
          }
        },
        data
      },
      // 最内层半圆
      {
        name: '内层1',
        type: 'gauge',
        // 外层修改 这个需同步修改
        radius: '25%',

        ...commonConfig,
        ...angleConfig,

        // 线的修改
        axisLine: {
          show: true,
          lineStyle: {
            color: [[1, 'rgba(34, 181, 171, .2)']],
            // 宽度  指针覆盖的那个
            width: 5,
            opacity: 1
          }
        },
        data
      }
    ]
  }
  return option
}
外部引用
import { getGuageOptions } from './getOptions'


export default {
   // .....

  methods: {
    initEcharts () {
      this.chart = echarts.init(document.getElementById('chartBox'))
      // 指定图表的配置项和数据
      const options = getGuageOptions(50)
      // 使用刚指定的配置项和数据显示图表。
      this.chart.setOption(options)
      window.onresize = () => {
        this.chart.resize()
      }
    }
  }
}


 865
865

 被折叠的 条评论
为什么被折叠?
被折叠的 条评论
为什么被折叠?
 到【灌水乐园】发言


