


vue高德地图实现绘制矢量图形功能,需要注册并登录高德地图开发平台申请密钥,然后安装高德地图加载器,这里就不在介绍了,直接看代码。
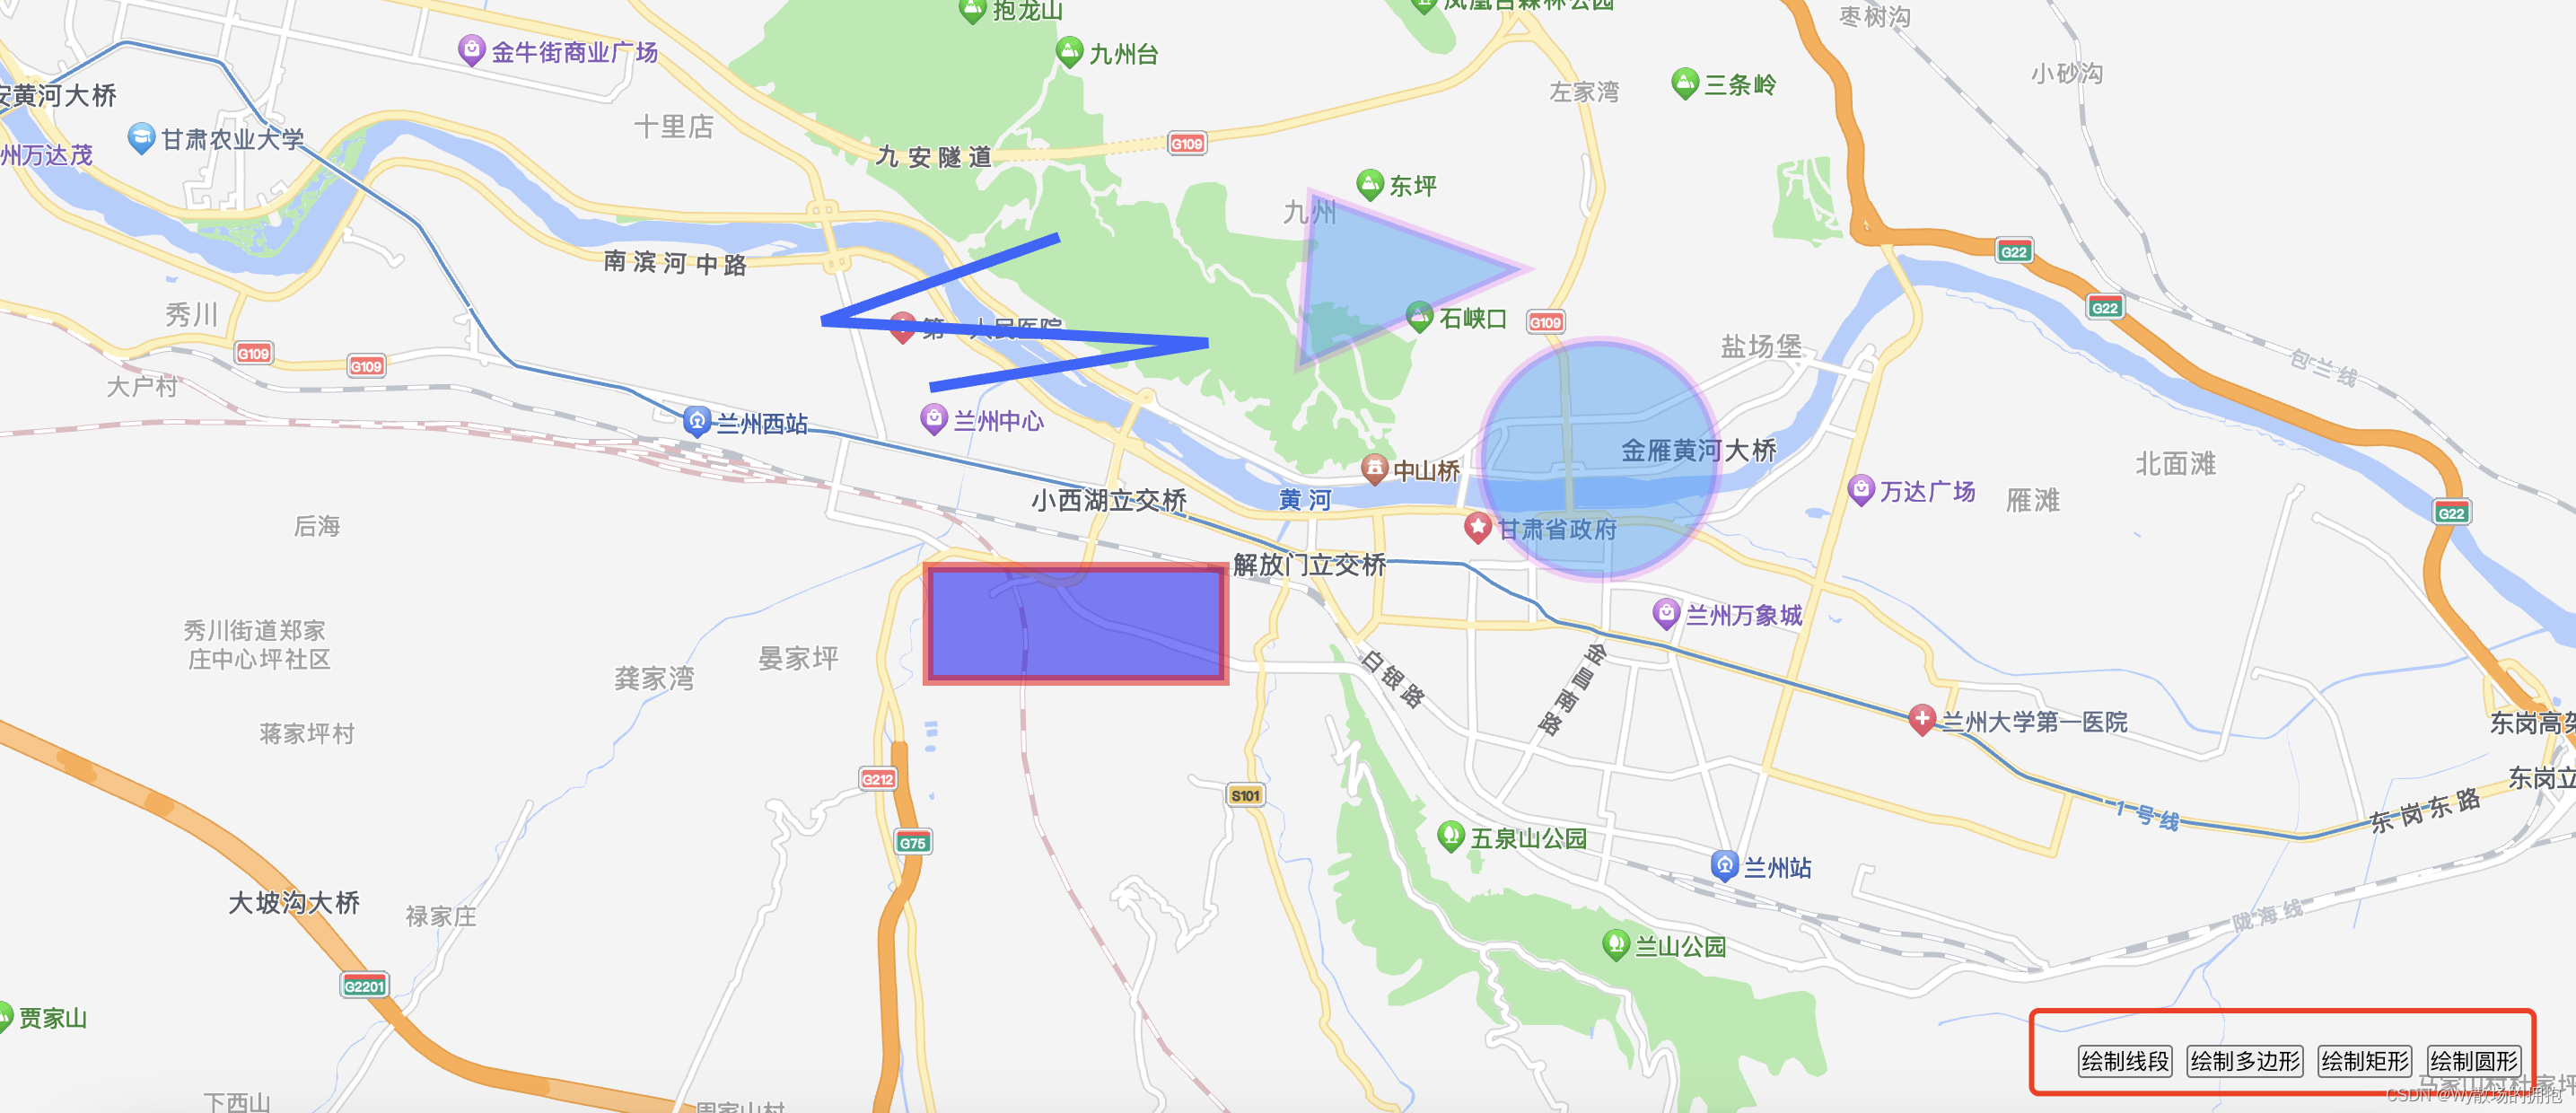
1、效果图如下:
点击底部按钮实现绘制
<template>
<div class="container">
<div ref="mapContainer" class="map-container"></div>
<div class="btnList">
<button class="btn" ="drawPolyline()">绘制线段</button>
<button class="btn" ="drawPolygon()">绘制多边形</button>
<button class="btn" ="drawRectangle()">绘制矩形</button>
<button class="btn" ="drawCircle()">绘制圆形</button>
</div>
</div>
</template>
<script>
import AMapLoader from '@amap/amap-jsapi-loader'
window._AMapSecurityConfig = {
securityJsCode: '你的安全密钥'
}
export default {
data() {
return {}
},
mounted() {
this.initMap()
},
methods: {
initMap() {
AMapLoader.load({
key: '你的key值',
version: '2.0', // 指定要加载的 JSAPI 的版本,缺省时默认为 1.4.15
plugins: ['AMap.AutoComplete', 'AMap.PlaceSearch', 'AMap.MouseTool'] // 需要使用的的插件列表,如比例尺'AMap.Scale'等
})
.then((AMap) => {
// 初始化地图
var map = new AMap.Map(this.$refs.mapContainer, {
viewMode: '2D', // 是否为3D地图模式
zoom: 13, // 初始化地图级别
center: [103.834228, 36.060798], // 中心点坐标
resizeEnable: true
})
// 绘制矢量图形
this.mouseTool = new AMap.MouseTool(map)
})
.catch((e) => {
console.log(e)
})
},
// 绘制线段
drawPolyline() {
this.mouseTool.polyline({
strokeColor: '#3366FF',
strokeOpacity: 1,
strokeWeight: 6,
strokeStyle: 'solid'
})
},
// 绘制多边形
drawPolygon() {
this.mouseTool.polygon({
strokeColor: '#FF33FF',
strokeWeight: 6,
strokeOpacity: 0.2,
fillColor: '#1791fc',
fillOpacity: 0.4,
strokeStyle: 'solid'
})
},
// drawRectangle
drawRectangle() {
this.mouseTool.rectangle({
strokeColor: 'red',
strokeOpacity: 0.5,
strokeWeight: 6,
fillColor: 'blue',
fillOpacity: 0.5,
strokeStyle: 'solid'
})
},
// 绘制圆形
drawCircle() {
this.mouseTool.circle({
strokeColor: '#FF33FF',
strokeWeight: 6,
strokeOpacity: 0.2,
fillColor: '#1791fc',
fillOpacity: 0.4,
strokeStyle: 'solid'
})
}
}
}
</script>
<style lang="scss" scoped>
.container {
width: 100%;
height: 100%;
position: relative;
.map-container {
width: 100%;
height: 100%;
}
.btnList {
position: absolute;
bottom: 5%;
right: 2%;
.btn {
margin: 5px;
}
}
}
</style>


 6520
6520

 被折叠的 条评论
为什么被折叠?
被折叠的 条评论
为什么被折叠?
 到【灌水乐园】发言


