


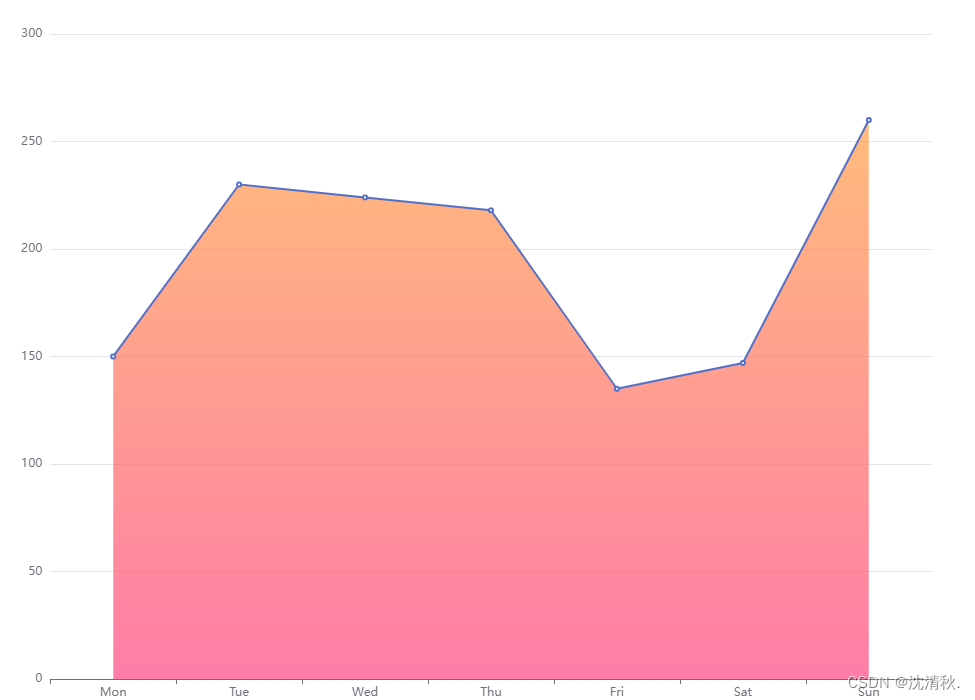
主要是设置areaStyle区域填充样式,设置后显示成区域面积图。
示例代码:
option = {
  xAxis: {
    type: 'category',
    data: ['Mon', 'Tue', 'Wed', 'Thu', 'Fri', 'Sat', 'Sun']
  },
  yAxis: {
    type: 'value'
  },
  series: [
    {
      data: [150, 230, 224, 218, 135, 147, 260],
      type: 'line',
      areaStyle: {
        color: new echarts.graphic.LinearGradient(0, 0, 0, 1, [
          {
            offset: 0,
            color: 'rgb(255, 158, 68)'
          },
          {
            offset: 1,
            color: 'rgb(255, 70, 131)'
          }
        ])
      },
    }
  ]
};
效果图:
对于文档可参考:https://echarts.apache.org/zh/option.html#series-line.areaStyle


 1347
1347

 被折叠的 条评论
为什么被折叠?
被折叠的 条评论
为什么被折叠?
 到【灌水乐园】发言


