


不多废话,代码如下:
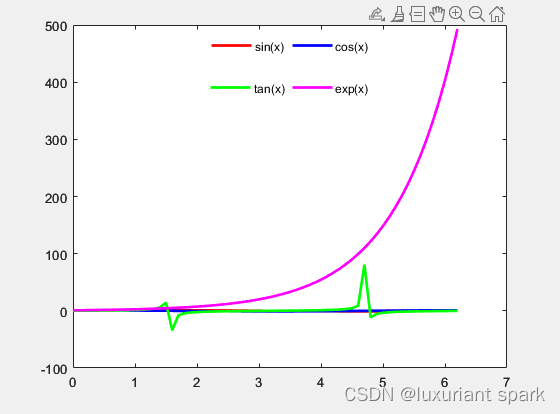
x = 0:0.1:2*pi;
y1 = sin(x);
y2 = cos(x);
y3 = tan(x);
y4 = exp(x);

% 获取每个曲线的句柄
h1 = plot(x, y1, 'r', 'LineWidth', 2);
hold on;
h2 = plot(x, y2, 'b', 'LineWidth', 2);
h3 = plot(x, y3, 'g', 'LineWidth', 2);
h4 = plot(x, y4, 'm', 'LineWidth', 2);

% 创建第一行图例并设置标签
lgd1 = legend([h1, h2], 'sin(x)', 'cos(x)', 'Location', 'north', 'Orientation', 'horizontal');
% 图例的方框比较难看,如果觉得可以接受的话也可以把这行代码注释掉
legend boxoff;

% 创建不可见的辅助轴对象,并将第二行图例的位置向下移动
ah = axes('position', get(gca, 'position')+ [0, -0.1, 0, 0], 'visible', 'off');

% 在辅助轴上创建第二行图例并设置标签
lgd2 = legend(ah, [h3, h4], 'tan(x)', 'exp(x)', 'Location', 'north', 'Orientation', 'horizontal');
legend boxoff;
效果如图所示:


 2万+
2万+

 被折叠的 条评论
为什么被折叠?
被折叠的 条评论
为什么被折叠?
 到【灌水乐园】发言


