highcharts 3d饼图

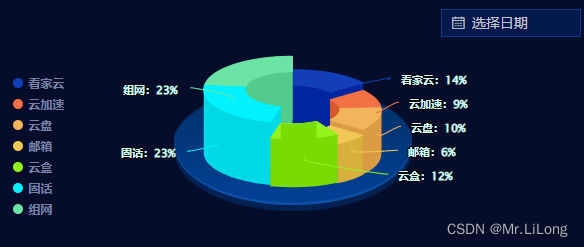
该代码示例展示了如何在Vue.js组件中使用Highcharts库来生成3D饼图,动态计算每个数据项的百分比并渲染图表的高度。同时,它还处理窗口缩放事件以适应页面尺寸变化。

摘要生成于 C知道 ,由 DeepSeek-R1 满血版支持, 前往体验 >

效果图

在这里插入图片描述

代码

<template>
    <div :id="id" style="height: 300px; width: 100%"></div>
</template>
<script>
import highcharts from "highcharts";
export default {
    props: {
        id: {
            type: String,
            required: true,
        },
        dataList: {
            type: Array,
            default: () => ([
                {
                    name: "看家云",
                    y: 10254,
                    h: 0,
                    bfb: 0
                },
                {
                    name: "云加速",
                    y: 6894,
                    h: 0,
                    bfb: 0
                },
                {
                    name: "云盘",
                    y: 7667,
                    h: 0,
                    bfb: 0
                },
                {
                    name: "邮箱",
                    y: 4287,
                    h: 0,
                    bfb: 0
                },
                {
                    name: "云盒",
                    y: 8687,
                    h: 0,
                    bfb: 0
                },
                {
                    name: "固话",
                    y: 16112,
                    h: 0,
                    bfb: 0
                },
                {
                    name: "组网",
                    y: 16112,
                    h: 0,
                    bfb: 0
                }
            ])
        }
    },
    watch: {
        dataList() {
            this.$nextTick(() => {
                this.initOption();
            });
        },
    },
    mounted() {
        // this.$nextTick(() => {
        this.initOption();
        // });
        window.addEventListener("resize", this.initOption);
    },
    destroyed() {
        window.removeEventListener("resize", this.initOption);
    },
    methods: {
        initOption() {
            let quantity = 0; // 总数
            this.dataList.forEach((item) => {
                quantity += item.y;
            });
            this.dataList.forEach((item) => {
                item.bfb = parseInt((item.y / quantity) * 100);
                item.h = item.bfb * 1.5 >= 70 ? 70 : item.bfb * 1.5
                // item.h = parseInt(0.86 * item.bfb); // 最高高度60,根据比例渲染高度
                // console.log(this.dataList, "dataList----->>>");
            });
            // 修改3d饼图绘制过程
            var each = highcharts.each,
                round = Math.round,
                cos = Math.cos,
                sin = Math.sin,
                deg2rad = Math.deg2rad;
            highcharts.wrap(
                highcharts.seriesTypes.pie.prototype,
                "translate",
                function (proceed) {
                    proceed.apply(this, [].slice.call(arguments, 1));
                    // Do not do this if the chart is not 3D
                    if (!this.chart.is3d()) {
                        return;
                    }
                    var series = this,
                        chart = series.chart,
                        options = chart.options,
                        seriesOptions = series.options,
                        depth = seriesOptions.depth || 0,
                        options3d = options.chart.options3d,
                        alpha = options3d.alpha,
                        beta = options3d.beta,
                        z = seriesOptions.stacking
                            ? (seriesOptions.stack || 0) * depth
                            : series._i * depth;
                    z += depth / 2;
                    if (seriesOptions.grouping !== false) {
                        z = 0;
                    }
                    each(series.data, function (point) {
                        var shapeArgs = point.shapeArgs,
                            angle;
                        point.shapeType = "arc3d";
                        var ran = point.options.h;
                        shapeArgs.z = z;
                        shapeArgs.depth = depth * 0.75 + ran;
                        shapeArgs.alpha = alpha;
                        shapeArgs.beta = beta;
                        shapeArgs.center = series.center;
                        shapeArgs.ran = ran;
                        angle = (shapeArgs.end + shapeArgs.start) / 2;
                        point.slicedTranslation = {
                            translateX: round(
                                cos(angle) * seriesOptions.slicedOffset * cos(alpha * deg2rad)
                            ),
                            translateY: round(
                                sin(angle) * seriesOptions.slicedOffset * cos(alpha * deg2rad)
                            ),
                        };
                    });
                }
            );
            (function (H) {
                H.wrap(
                    highcharts.SVGRenderer.prototype,
                    "arc3dPath",
                    function (proceed) {
                        // Run original proceed method
                        var ret = proceed.apply(this, [].slice.call(arguments, 1));
                        ret.zTop = (ret.zOut + 0.5) / 100;
                        return ret;
                    }
                );
            })(highcharts);
            highcharts.chart(this.id, {
                chart: {
                    animation: false,
                    backgroundColor: "none",
                    type: "pie", //饼图
                    margin: [0, 0, 0, 0],
                    options3d: {
                        enabled: true, //使用3d功能
                        alpha: 68, //延y轴向内的倾斜角度
                        beta: 0,
                    },
                    events: {
                        load: function () {
                            var each = highcharts.each,
                                points = this.series[0].points;
                            each(points, function (p, i) {
                                p.graphic.attr({
                                    translateY: -p.shapeArgs.ran,
                                });
                                p.graphic.side1.attr({
                                    translateY: -p.shapeArgs.ran,
                                });
                                p.graphic.side2.attr({
                                    translateY: -p.shapeArgs.ran,
                                });
                            });
                        },
                    },
                },
                legend: {
                    enabled: true, // 关闭图例
                    align: "left", //水平方向位置
                    verticalAlign: "top", //垂直方向位置
                    layout: "vertical",
                    y: 60,
                    symbolWidth: 10,
                    symbolHeight: 10,
                    itemMarginBottom: 3,
                    useHTML: true,
                    itemStyle: {
                        color: "#7B81A6",
                        fontSize: 11,
                    },
                },
                title: {
                    // enabled: false,
                    text: "",
                },
                subtitle: {
                    text: "",
                },
                plotOptions: {
                    pie: {
                        allowPointSelect: false, // 禁用点击
                        cursor: "pointer",
                        depth: 45,
                        showInLegend: true,
                        size: "75%", // 外圈直径大小
                        innerSize: 95, // 内圈直径大小
                        center: ["50%", "50%"],
                        colors: [
                            "#123FB8",
                            "#F37245",
                            "#F4B45E",
                            "#EFC855",
                            "#92F41C",
                            "#00F2FF",
                            "#6BE4A5",
                        ],
                        dataLabels: {
                            enabled: true, //是否显示饼图的线形tip
                            distance: 15,
                            borderColor: '#007acc',
                            align: "center",
                            // verticalAlign: 'top',
                            position: "right",
                            format: "{point.name}:{point.bfb}%",
                            // formatter: (point,b) => {
                            //   console.log(point,'ponit-->>')
                            //   console.log(b,'ponit-->>')
                            // },
                            color: '#D4FEFF',
                            fontSize: 14,
                        },
                    },
                },
                credits: {
                    enabled: false, // 禁用版权信息
                },
                series: [
                    {
                        type: "pie",
                        name: "数量",
                        data: this.dataList,
                    },
                ],
            });
        },
    },
};
</script>
评论
添加红包

请填写红包祝福语或标题

红包个数最小为10个

红包金额最低5元

当前余额3.43前往充值 >
需支付:10.00
成就一亿技术人!
领取后你会自动成为博主和红包主的粉丝 规则
hope_wisdom
发出的红包
实付
使用余额支付
点击重新获取
扫码支付
钱包余额 0

抵扣说明:

1.余额是钱包充值的虚拟货币,按照1:1的比例进行支付金额的抵扣。
2.余额无法直接购买下载,可以购买VIP、付费专栏及课程。

余额充值