


 本文介绍了一种使用科学计算库NumPy进行概率模拟的方法,通过模拟掷骰子实验,展示了如何统计和可视化两个骰子投掷结果的分布。实验共进行了1000次,结果通过直方图展示,每个点数出现的频率清晰可见。
# -*- coding: utf-8 -*-
"""
      作者:宇轩亚40
      功能:使用科学计算库NumPy模拟掷骰子
"""
import matplotlib.pyplot as plt
import numpy as np
#中文显示
plt.rcParams['font.sans-serif'] = ['SimHei']
plt.rcParams['axes.unicode_minus'] = False

def main():
    total_times = 1000
    #记录骰子的结果
    roll1_arr = np.random.randint(1, 7, size=total_times)
    roll2_arr = np.random.randint(1, 7, size=total_times)
    result_arr = roll1_arr + roll2_arr

    hist, bins = np.histogram(result_arr, bins=range(2, 14))
    print(hist)
    print(bins)

    #数据可视化
    plt.hist(result_arr, bins=range(2, 14), normed=1, edgecolor='black', linewidth=1, rwidth=0.8)

    #设置x轴坐标点显示
    tick_labels = ['2点', '3点', '4点', '5点', '6点', '7点', '8点', '9点',
                   '10点', '11点', '12点']
    tick_pos = np.arange(2, 13) + 0.5
    plt.xticks(tick_pos, tick_labels)
    plt.title('骰子点数统计')
    plt.xlabel('点数')
    plt.ylabel('频率')
    plt.show()

if __name__ == '__main__':
     main()
运行上述程序,结果如下图所示:
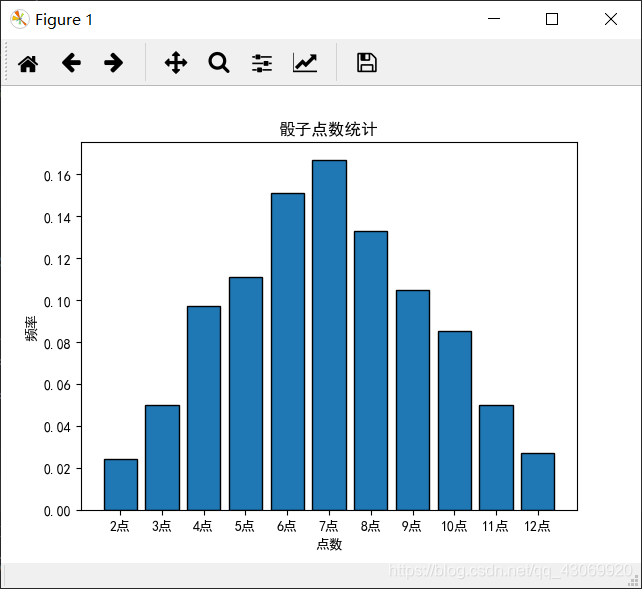
同时,程序还会显示如下的运行结果:
[ 24  50  97 111 151 167 133 105  85  50  27]
[ 2  3  4  5  6  7  8  9 10 11 12 13]


 1723
1723

 被折叠的 条评论
为什么被折叠?
被折叠的 条评论
为什么被折叠?
 到【灌水乐园】发言


