


 本文介绍了如何使用ECharts库实现时间轴(timeline),包括设置数据、自定义label显示、仅在当前选中时间点显示文本以及处理timelinechanged事件。主要展示了数据设置、label配置和事件处理的关键代码片段。
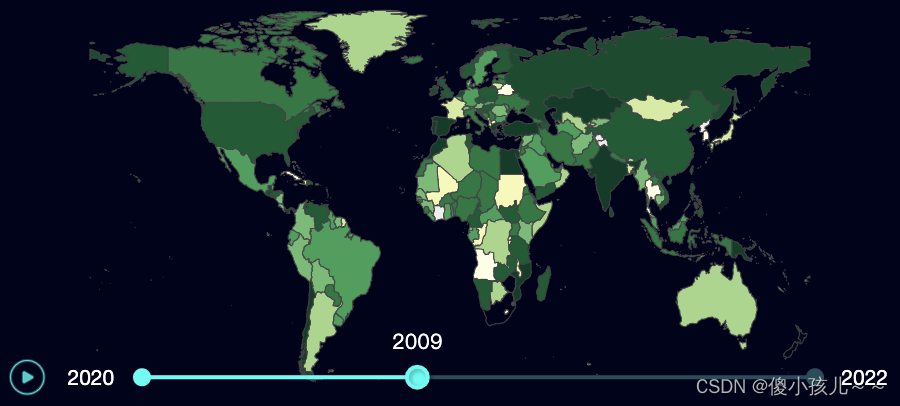
一、效果图
二、主要代码实现
1、数据设置,设置中间数据的symbolSize为0
var cenSymbolSize = 0;
var timelineData = [
	{
		value: '2000',
		symbolSize: fontSize(0.12)
	},{
		value: '2001',
		symbolSize: cenSymbolSize
	},
	...
	{
		value: '2002',
		symbolSize: cenSymbolSize
	},{
		value: '2022',
		symbolSize: fontSize(0.12)
	},
];
2、timeline设置:label默认显示第一个,其他的返回空。
timeline: {
	axisType: 'category',
	autoPlay: false,
	playInterval: 1000,
	label: {
		show:true,
		position:'top',
		interval:0,
		align:'center',
		formatter: function(value, index) {
			// 仅在当前选中的时间点显示文本
			return index === 0 ? value : '';
		}
	},
	lineStyle:{
	      color:'#1e4e5c',
	},
	itemStyle:{
	      color:'#1e4e5c',
	},
	checkpointStyle:{
	      color:'#00FFF4',
		  borderColor: '#00FFF4',
	},
	progress:{
	    itemStyle:{
		      color:'#00FFF4',
		},
		lineStyle:{
		       color:'#00FFF4',
		},
		label:{
			color:'#00FFF4',
		}
	},
	controlStyle:{
	      showPrevBtn:false,
	      showNextBtn:false,
	},
	data:timelineData
},
2、timelinechanged事件处理:当前点击的时间轴索引对应label的索引则返回值,否则为空,就能仅显示当前选中的时间点的文本。
myChart.on('timelinechanged', function(event) {
	 var currentIndex = event.currentIndex;
	// 更新时间轴数据项,以显示当前选中的文本
	myChart.setOption({
	   timeline: {
		   // 更新 label 的 formatter,仅显示当前选中的时间点的文本
		   label: {
			   formatter: function(value, index) {
				   return index == currentIndex ? value : '';
			   }
		   }
	   }
	});
});


 被折叠的 条评论
为什么被折叠?
被折叠的 条评论
为什么被折叠?
 到【灌水乐园】发言


