


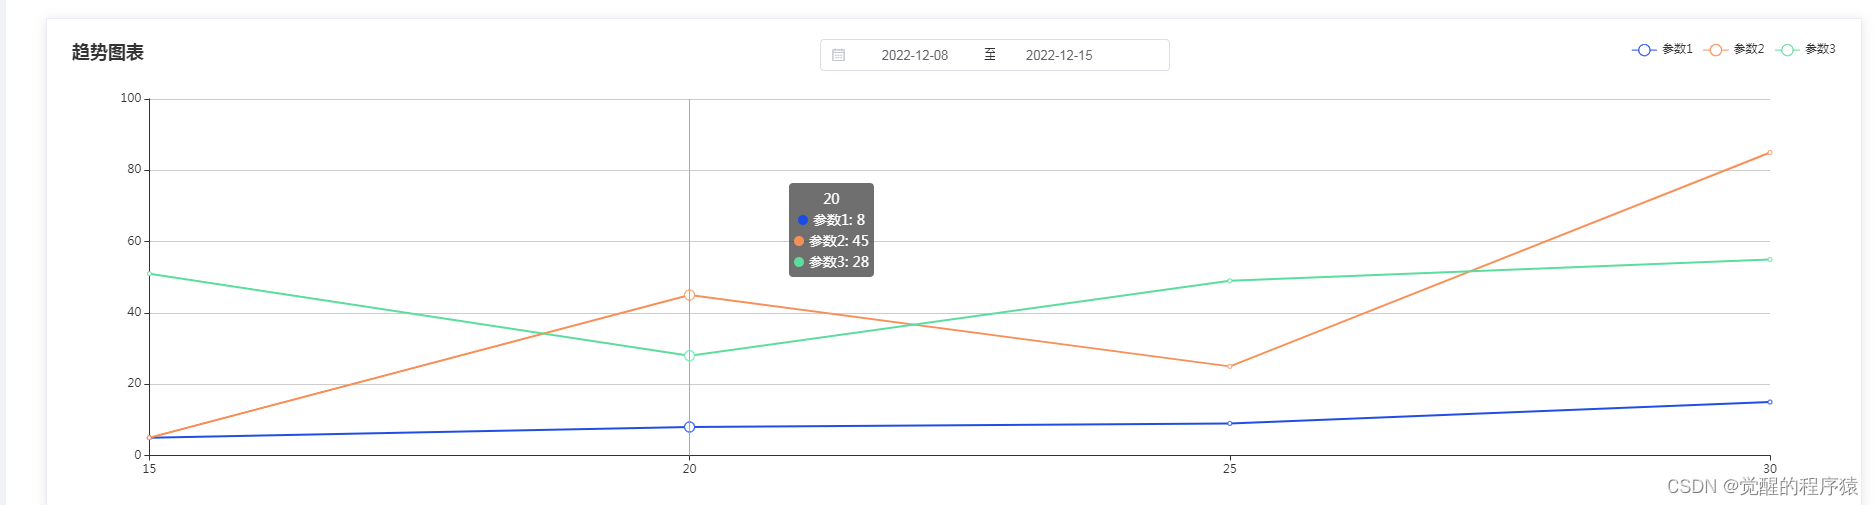
效果图
官方文档链接:echarts
(其中大部分配置信息都在文档的配置项手册当中)
1.vue npm安装
npm install echarts --save
2.在需要的页面中引入echarts
import * as echarts from "echarts";
3.定义一个div,此处我的高度是写死的,通过id来创建图表
<div id="J_chartLineBox" style="width: 100%; height: 450px"></div>
js
 data() {
    return {
      chartLines1: {},
    };
  },

  mounted() {
    this.initChartLines1();
  },

  methods: {
      initChartLines1() {
      this.$nextTick(() => {
        this.chartLines1 = echarts.init(
          document.getElementById("J_chartLineBoxs1")
        );
        // 设置图标配置
        var x1 = [15,20,25,30];
        var y1 = [5,8,9,15];
        var y2 = [5,45,25,85];
        var y3 = [51,28,49,55];
        // 图表配置
        var option = {
          title: {
            text: "趋势图表",  //图表标题
          },
          tooltip: {
            trigger: "axis",
          },
          color: ["#194ce5", "#f88f56", "#5ddc9c"], //设置每条数据的颜色
          legend: {
            left: "right",
          },
          grid: {
            left: "3%",
            right: "4%",
            bottom: "3%",
            containLabel: true,
          },
          xAxis: {
            type: "category",
            boundaryGap: false,
            data: x1,
          },
          yAxis: {
            type: "value",
          },
          series: [
            {
              name: "参数1",
              type: "line",
              data: y1,
            },
            {
              name: "参数2",
              type: "line",
              data: y2,
            },
            {
              name: "参数3",
              type: "line",
              data: y3,
            },
          ],
        };
        this.chartLines1.clear();  //数据改变时先卸载再重新生成,实现数据更新
        this.chartLines1.setOption(option, true);
        window.addEventListener("resize", () => {  //通过窗口的大小实时改变图表大小
          this.chartLines1.resize();
        });
      });
    },
  }
以下便完成了echarts的基本使用


 6万+
6万+

 被折叠的 条评论
为什么被折叠?
被折叠的 条评论
为什么被折叠?
 到【灌水乐园】发言


