


 该博客详细介绍了天池数据英雄杯中对短租数据集的分析,包括探索性分析,如使用jieba库进行房源特征研究;数据清洗的小技巧;Airbnb房东职业化趋势,发现少数房东占有大量房源;区域房价分析;以及预告的机器学习实战部分。
数据listings:
id 房源ID
name 房源标题
host_id 主人id
host_name
heighbourhood_group 行政区ID
heighbourhood 行政区
latitude 维度
kongitude 经度
room_type 出租类型(entire home 或者 private room)
price 价格
minimum_nights 最少天数
number_of_reviews 评论数量
last_review 最近的评论时间
reviews_per_month 每月评论数量
calculated_host_listings_count 主人拥有的房子数量
availability_365
分析一:探索性分析
import pandas as pd
import numpy as np
import matplotlib.pyplot as plt
import seaborn as sns
pd.set_option('display.max_columns', None)
df = pd.read_csv('listings.csv', index_col=0) # 加载数据,使用第一列为默认索引
print(df.info())
# 描述信息
des_group = ['price', 'number_of_reviews', 'reviews_per_month', 'availability_365']
print(df.describe()[des_group])
# 数据清洗之查看空值信息
print(df.isnull().sum())
# 填充review数量为空的数值填充为均值
df.number_of_reviews.fillna(df.number_of_reviews.mean(), inplace=True)
print(df.isnull().sum())
# 创建子数据集
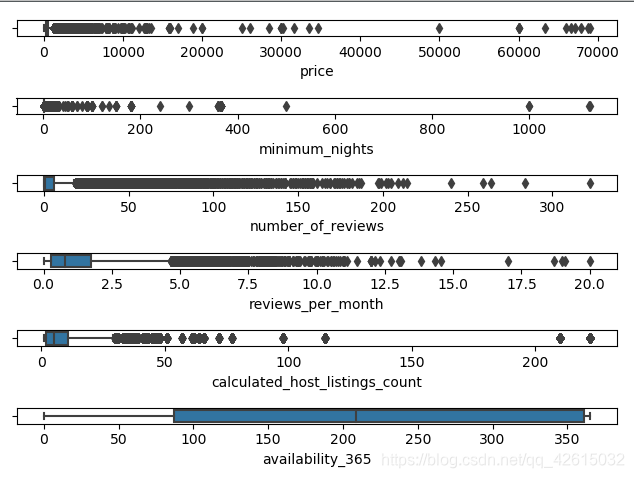
subsets = ['price', 'minimum_nights', 'number_of_reviews', 'reviews_per_month',
'calculated_host_listings_count', 'availability_365']
# 箱型图,获取数据大致分布情况,查看离群点信息
# 下面这个图好像很难得到有价值的信息,具体的应该缩小范围进一步查看
fig, axes = plt.subplots(len(subsets), 1)
plt.subplots_adjust(hspace=1)
for i, subset in enumerate(subsets):
sns.boxplot(df[subset], ax=axes[i], whis=2, orient='h')
plt.show()
# 探索性数据分析,数据集中性
def get_con(df):
    subsets = ['price', 'minimum_nights', 'number_of_reviews',
               'reviews_per_month', 'calculated_host_listings_count', 'availability_365']
    data = {

   }
    for i in subsets:
        data.setdefault(i, [])
        data[i].append(df[i].skew())
        data[i].append(df[i].kurt())
        data[i].append(df[i].mean())
        data[i].append(df[i].std())
        data[i].append(df[i].std()/df[i].mean())
        data[i].append(df[i].max()-df[i].min())
        data[i].append(df[i].quantile(0.75)-df[i].quantile(0.25))
        data[i].append(df[i].median())
    data_df = pd.DataFrame(data, index=['偏度', '峰度', '均值', '标准差',
                                        '变异
最低0.47元/天 解锁文章


 6496
6496

 被折叠的 条评论
为什么被折叠?
被折叠的 条评论
为什么被折叠?
 到【灌水乐园】发言


