


如图,就是当tab切换时候,出现的echarts渲染堆积到一块的问题
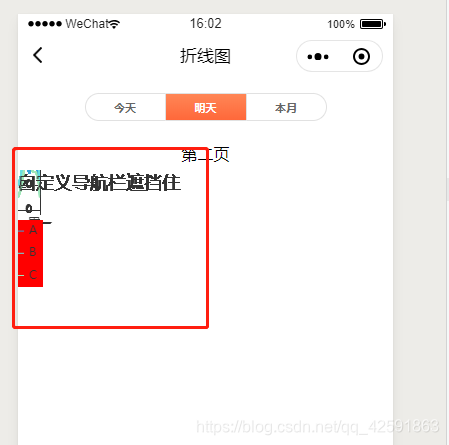
如何解决呢?
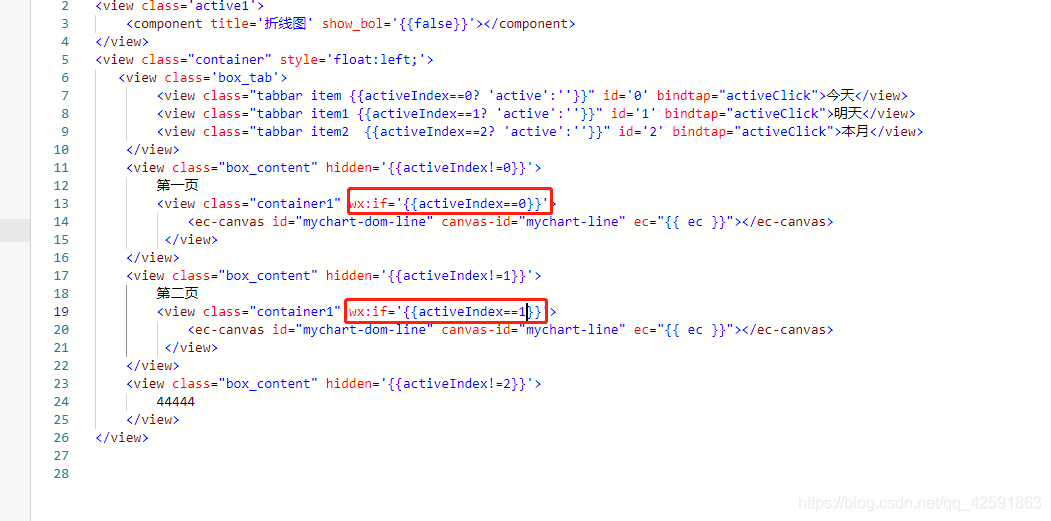
思路:只有在切换到当前tab对应的页面时该页面的图表才会加载。那就在包裹echarts图的盒子上加一个判断条件,当当前activeIndex==0(或者1,2等)的时候再加载这个图。
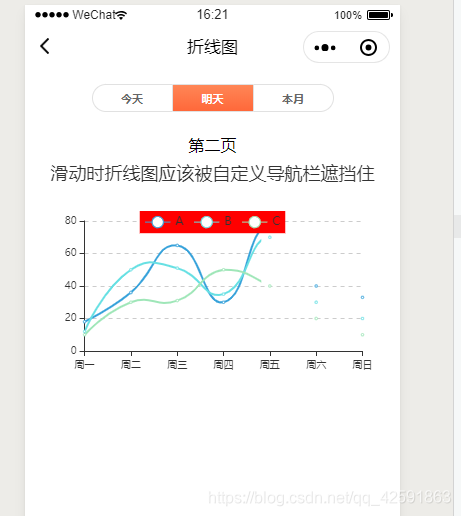
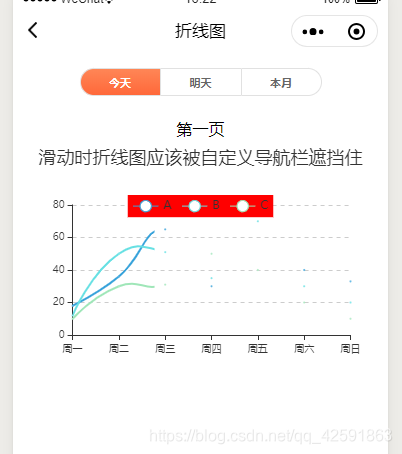
来看看效果:tab为今天和明天时候,对应的图都能正常显示了。
1.先放一下整体的布局的代码。
html:
<view class='active1'>
    <component title='折线图' show_bol='{{false}}'></component>
</view>
<view class="container" style='float:left;'>
  <view class='box_tab'>
        <view class="tabbar item {{activeIndex==0? 'active':''}}" id='0' bindtap="activeClick">今天</view>
        <view class="tabbar item1 {{activeIndex==1? 'active':''}}" id='1' bindtap="activeClick">明天</view>
        <view class="tabbar item2  {{activeIndex==2? 'active':''}}" id='2' bindtap="activeClick">本月</view>
    </view>
    <view class="box_content" hidden='{{activeIndex!=0}}'>
        第一页
        <view class="container1" wx:if='{{activeIndex==0}}'>
            <ec-canvas id="mychart-dom-line" canvas-id="mychart-line" ec="{{ ec }}"></ec-canvas>
         </view>
    </view>
    <view class="box_content" hidden='{{activeIndex!=1}}'>
        第二页
        <view class="container1" wx:if='{{activeIndex==1}}'>
            <ec-canvas id="mychart-dom-line" canvas-id="mychart-line" ec="{{ ec }}"></ec-canvas>
         </view>
    </view>
    <view class="box_content" hidden='{{activeIndex!=2}}'>
        44444
    </view>
</view>
接下来是js的代码:
import * as echarts from '../../ec-canvas/echarts';

const app = getApp();

function initChart(canvas, width, height) {
  const chart = echarts.init(canvas, null, {
    width: width,
    height: height
  });
  canvas.setChart(chart);

  var option = {
    title: {
      text: '滑动时折线图应该被自定义导航栏遮挡住',
      left: 'center'
    },
    color: ["#37A2DA", "#67E0E3", "#9FE6B8"],
    legend: {
      data: ['A', 'B', 'C'],
      top: 50,
      left: 'center',
      backgroundColor: 'red',
      z: 100
    },
    grid: {
      containLabel: true
    },
    tooltip: {
      show: true,
      trigger: 'axis'
    },
    xAxis: {
      type: 'category',
      boundaryGap: false,
      data: ['周一', '周二', '周三', '周四', '周五', '周六', '周日'],
      // show: false
    },
    yAxis: {
      x: 'center',
      type: 'value',
      splitLine: {
        lineStyle: {
          type: 'dashed'
        }
      }
      // show: false
    },
    series: [{
      name: 'A',
      type: 'line',
      smooth: true,
      data: [18, 36, 65, 30, 78, 40, 33]
    }, {
      name: 'B',
      type: 'line',
      smooth: true,
      data: [12, 50, 51, 35, 70, 30, 20]
    }, {
      name: 'C',
      type: 'line',
      smooth: true,
      data: [10, 30, 31, 50, 40, 20, 10]
}]
  };

  chart.setOption(option);
  return chart;
}

Page({
  onShareAppMessage: function (res) {
    return {
      title: 'ECharts 可以在微信小程序中使用啦!',
      path: '/pages/index/index',
      success: function () { },
      fail: function () { }
    }
  },
  data: {
    ec: {
      onInit: initChart,
    },
      activeIndex: 0
  },
    activeClick: function (e) {
        var that = this;
        that.setData({
            activeIndex: e.currentTarget.id,
        })
    },
  onReady() {
  }
});源代码链接:https://github.com/mr0723/echarts-bug


 被折叠的 条评论
为什么被折叠?
被折叠的 条评论
为什么被折叠?
 到【灌水乐园】发言


