


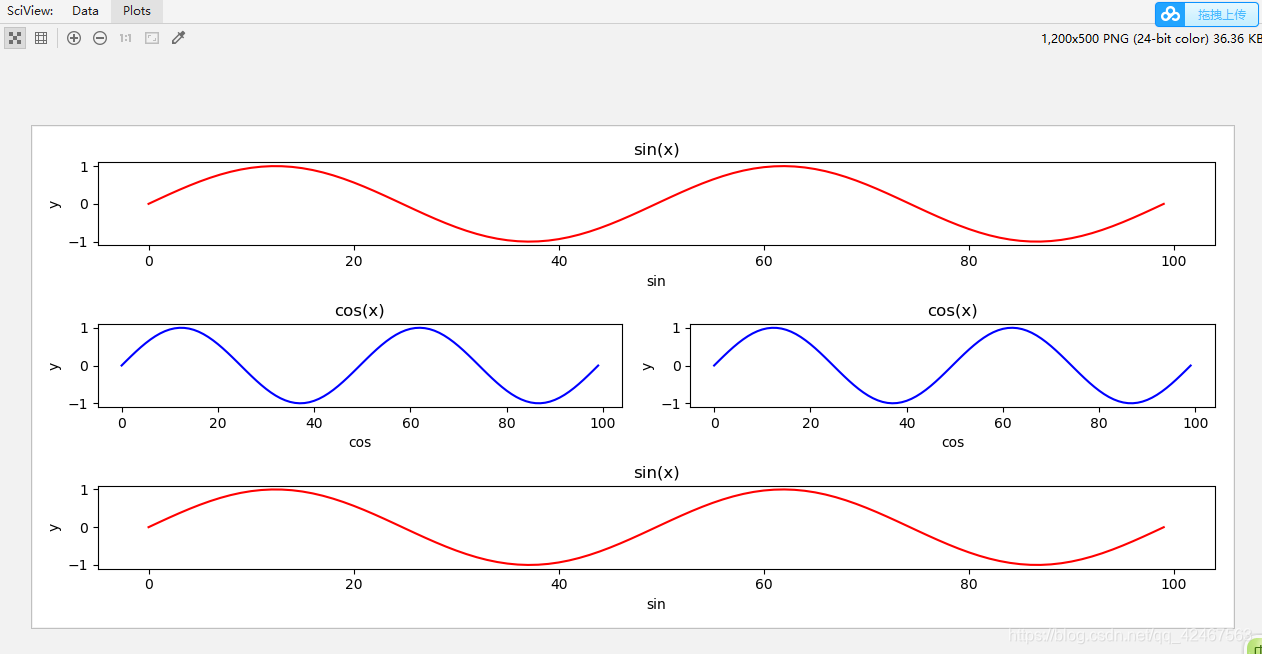
 本文通过实例演示了如何使用Python的Matplotlib库绘制正弦和余弦曲线,详细介绍了如何设置画布大小、生成x轴数据、计算y轴数据以及如何配置子图,包括设置标题、标签和颜色。
import matplotlib.pyplot as plt #导入需要的包,取别名为plt
import numpy as np #导入需要的包,取别名为np
plt.figure(figsize=(12,5)) #设置画布大小
x=np.linspace(-2*np.pi,2*np.pi,100) #x轴的范围,并分为100份
y_sin=np.sin(x)
y_cos=np.cos(x)
#获取子图的配置
ax_sin=plt.subplot(311) #3行一列第一个 把每行图形都想象成一列,这个就是3行一列的第一个图像 所以是311
ax_sin.set_title('sin(x)')
ax_sin.set_xlabel('sin')
ax_sin.set_ylabel('y')
ax_sin.plot(y_sin,c='r')
ax_sin=plt.subplot(323) #3行2列第3个 把第一行第二行图形都想象成2列,这个就是3行2列的第3个图像 所以是323
ax_sin.set_title('cos(x)')
ax_sin.set_xlabel('cos')
ax_sin.set_ylabel('y')
ax_sin.plot(y_sin,c='b')
ax_sin1=plt.subplot(324) #3行2列第4个 把第一行第二行图形都想象成2列,这个就是3行2列的第4个图像 所以是324
ax_sin1.set_title('cos(x)')
ax_sin1.set_xlabel('cos')
ax_sin1.set_ylabel('y')
ax_sin1.plot(y_sin,c='b')
ax_sin=plt.subplot(313) #三行一列第3个 把每行图形都想象成一列,这个就是3行一列的第三个图像 所以是313
ax_sin.set_title('sin(x)')
ax_sin.set_xlabel('sin')
ax_sin.set_ylabel('y')
ax_sin.plot(y_sin,c='r')


 852
852

 被折叠的 条评论
为什么被折叠?
被折叠的 条评论
为什么被折叠?
 到【灌水乐园】发言


