


<chart-speed id="speedChart" :speed="speed"/>
<chart-soc id="socChart" :soc="soc"/>
<template>
<div class="speed-echart">
<echarts
:id="id"
:options="options"
height="100%"/>
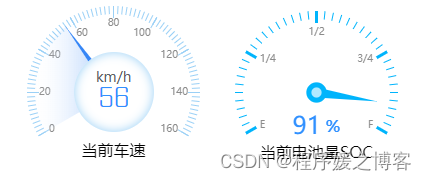
<div class="speed">
<span>km/h</span>
<p>{{ speed }}</p>
</div>
</div>
</template>
<script>
// 引入第三方组件
import Echarts from '@/components/Echarts'
export default {
components: {
Echarts
},
props: {
id: {
type: String,
default: ''
},
speed: {
type: Number,
default: 0
}
},
data () {
return {
options: {},
max: 160
}
},
watch: {
speed: {
handler (newVal, oldVal) {
this.options = {
series: [
// 外围刻度
{
type: 'gauge',
center: ['50%', '50%'],
radius: '100%',
splitNumber: 8,
min: 0,
max: this.max,
startAngle: 210,
endAngle: -30,
// 仪表盘轴线
axisLine: {
// lineStyle: {
// color: [[1, '#fff']]
// }
// 仪表盘轴线 // 无数据的底部背景圆环
show: true,
lineStyle: {
width: 5,
shadowColor: '#fff',
color: [[1, '#fff']]
},
},
// 分隔线样式
splitLine: {
show: true,
length: 12,
lineStyle: {
width: 1,
color: '#9ad0f6'
}
},
// 刻度样式
axisTick: {
show: true,
splitNumber: 10, // 分隔线之间分割的刻度数
length: 8,
lineStyle: {
color: '#9ad0f6',
width: 1
},
},
axisLabel: {
show: true,
distance: 5, // 标签与刻度线的距离
fontSize: 10,
color: '#8b8b8b',
// textStyle: {
// color: '#9ad0f6',
// fontSize: '16'
// }
},
detail: false
},
// 内侧指针、数值显示
{
name: this.$t('monitorCenter.currentSpeed'),
type: 'gauge',
center: ['50%', '50%'],
radius: '80%',
startAngle: 210,
endAngle: -30,
min: 0,
max: this.max,
axisLine: {
show: true,
lineStyle: {
width: '100%',
color: [
[newVal / this.max, new this.$echarts.graphic.LinearGradient(
0, 0, 1, 0, [{
offset: 0,
color: 'rgba(255,255,255, 0)'
},
{
offset: 1,
color: 'rgba(54, 134, 246, 0.5)'
}
]
)
],
[1, 'rgba(255,255,255, 0)']
]
}
},
axisTick: false,
splitLine: false,
axisLabel: false,
title: {
show: true,
offsetCenter: [0, '73%'],
color: '#000',
fontSize: 16,
borderRadius: 21,
padding: 5
},
detail: false,
pointer: {
show: true,
length: '100%',
width: 4
},
silent: true,
itemStyle: {
color: '#3686F6'
},
data: [{
value: newVal,
name: this.$t('monitorCenter.currentSpeed')
}]
}
]
}
},
deep: true,
immediate: true
}
}
}
</script>
<style scoped>
.speed-echart {
position: relative;
}
.speed-echart .speed {
position: absolute;
width: 80px;
height: 80px;
border-radius: 50%;
background: #fff;
top: 50%;
left: 50%;
margin-top: -40px;
margin-left: -40px;
box-shadow: #9ad0f6 0 0 10px 0 inset;
text-align: center;
padding-top: 15px;
box-sizing: border-box;
pointer-events: none;
}
.speed-echart .speed p {
margin: 0;
font-family: FZDLJT;
font-size: 26px;
line-height: 1;
color: #3090FF;
}
</style>
<template>
  <div>
    <echarts
      :id="id"
      :options="options"
      height="100%"/>
  </div>
</template>

<script>
  // 引入第三方组件
  import Echarts from '@/components/Echarts'
  export default {
    components: {
      Echarts
    },
    props: {
      id: {
        type: String,
        default: ''
      },
      soc: {
        type: Number,
        default: 0
      }
    },
    data () {
      return {
        options: {}
      }
    },
    watch: {
      soc: {
        handler (newVal, oldVal) {
          this.options = {
            series: [
              // 外围刻度
              {
                type: 'gauge',
                center: ['50%', '50%'],
                radius: '100%',
                splitNumber: 4,
                min: 0,
                max: 100,
                startAngle: 210,
                endAngle: -30,
                // 仪表盘轴线
                axisLine: {
                  width: 5,
                  shadowColor: '#fff',
                  lineStyle: {
                    color: [[1, '#fff']]
                  }
                },
                // 分隔线样式
                splitLine: {
                  show: true,
                  length: 12,
                  lineStyle: {
                    color: '#00B4FC'
                  }
                },
                // 刻度样式
                axisTick: {
                  show: true,
                  splitNumber: 10,    // 分隔线之间分割的刻度数
                  length: 8,
                  lineStyle: {
                    color: '#00B4FC',
                    width: 1
                  },
                  length: 8
                },
                axisLabel: {
                  show: true,
                  distance: 14, // 标签与刻度线的距离
                  fontSize: 10,
                  color: '#8b8b8b',
                  // textStyle: {
                  //   color: '#00B4FC',
                  //   fontSize: '16'
                  // },
                  formatter: function (value) {
                    let newVal = ''
                    switch (value) {
                      case 0:
                        newVal = 'E'
                        break
                      case 25:
                        newVal = '1/4'
                        break
                      case 50:
                        newVal = '{name|1/2}'
                        break
                      case 75:
                        newVal = '3/4'
                        break
                      case 100:
                        newVal = 'F'
                        break
                      default:
                        break
                    }
                    return newVal
                  },
                  rich: {
                    name: {
                      fontSize: 10,
                      color: '#8b8b8b',
                      // color: '#1F4E60',
                      // fontSize: 24
                    }
                  }
                },
                title: {
                  show: true,
                  offsetCenter: [0, '60%'],
                  color: '#000',
                  fontSize: 16,
                  borderRadius: 21,
                  padding: 5
                },
                detail: {
                  show: true,
                  offsetCenter: [0, '35%'],
                  textStyle: {
                    fontSize: 16,
                    color: '#3090FF'
                  },
                  formatter: [
                    '{value|' + this.soc + '}' + ' %'
                  ].join('\n'),

                  rich: {
                    value: {
                      fontSize: 24,
                      color: '#3090FF'
                    }
                  }
                },
                pointer: {
                  show: true,
                  length: '60%',
                  width: 5
                },
                silent: true,
                itemStyle: {
                  color: '#00B4FC'
                },
                data: [{
                  value: newVal,
                  name: this.$t('monitorCenter.currentBatterySOC')
                }]
              },
              // 画两个指针中间的圆圈
              {
                type: 'pie',
                radius: '10%',
                z: 10,
                label: false,
                labelLine: false,
                animation: false,
                silent: true,
                itemStyle: {
                  color: '#00B5FC'
                },
                data: [1]
              },
              {
                type: 'pie',
                radius: '5%',
                z: 11,
                label: false,
                labelLine: false,
                animation: false,
                silent: true,
                itemStyle: {
                  color: '#B1E9FF',
                },
                data: [1]
              }
            ]
          }
        },
        deep: true,
        immediate: true
      }
    }
  }
</script>

<style scoped>
</style>


 3万+
3万+

 被折叠的 条评论
为什么被折叠?
被折叠的 条评论
为什么被折叠?
 到【灌水乐园】发言


