


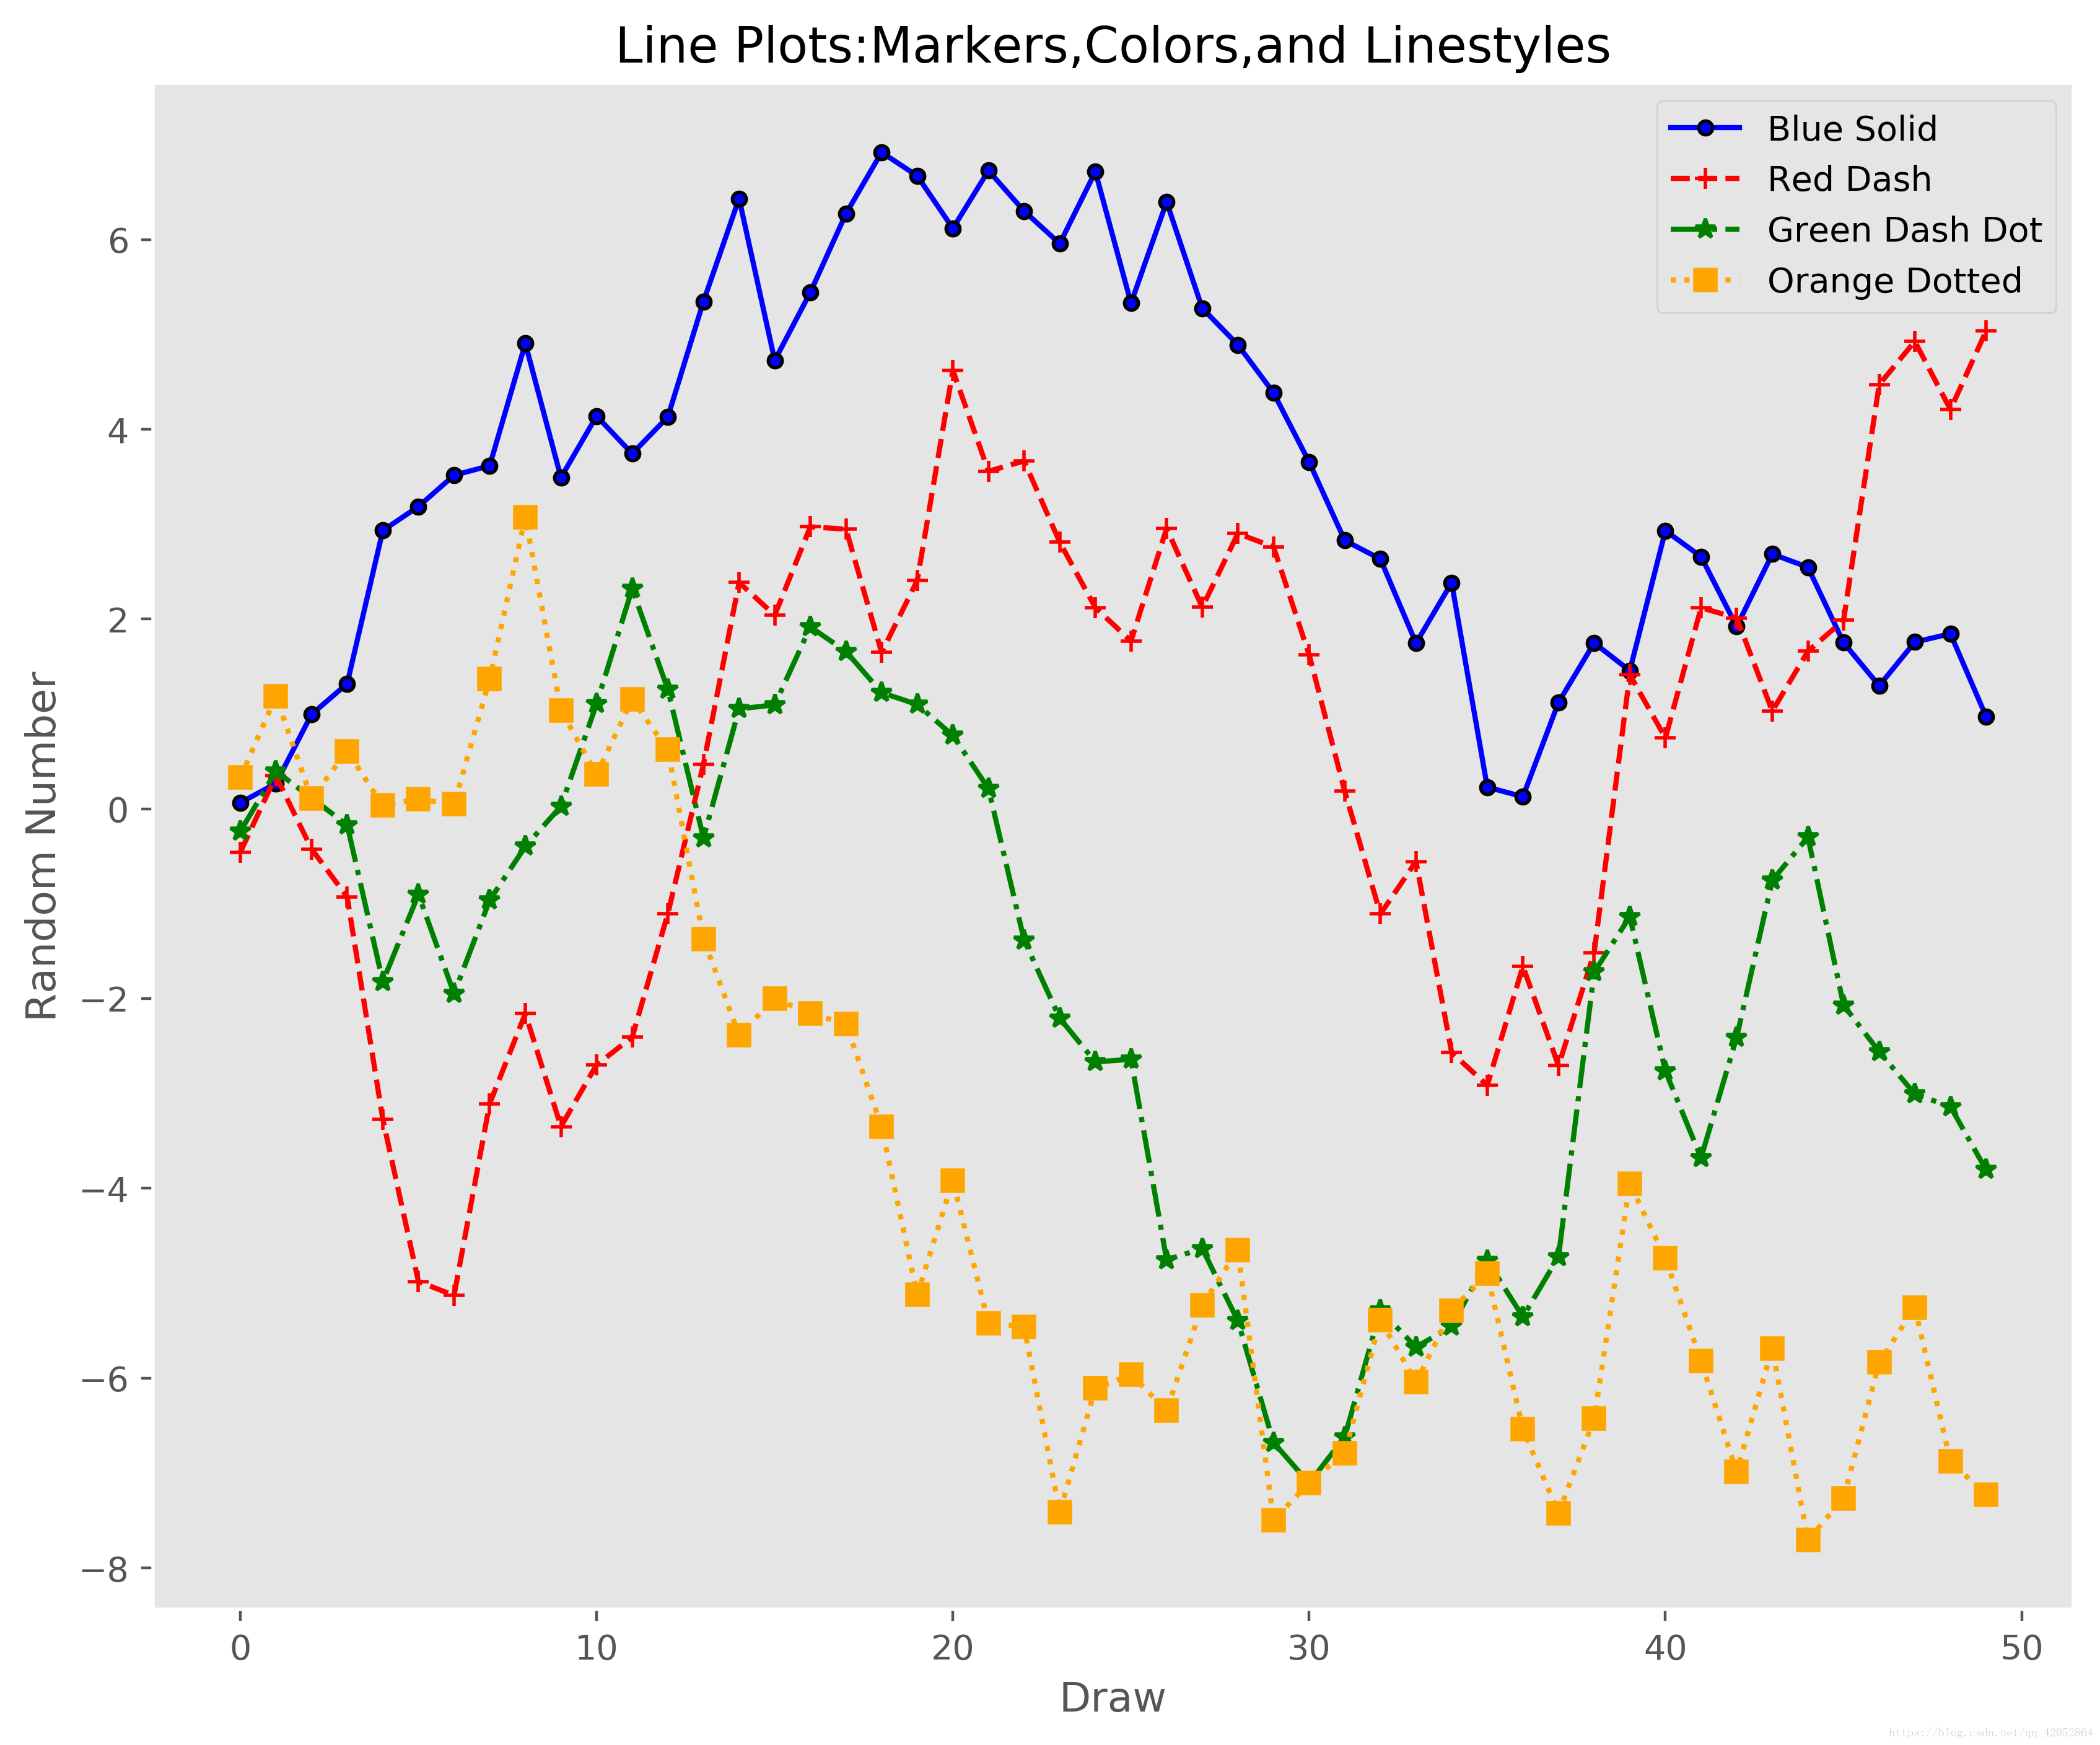
 本文通过使用Matplotlib库创建了一组具有不同标记、颜色和线型的折线图,并展示了如何设置图表样式,包括背景颜色、轴脊颜色等。此外还介绍了如何保存图表到文件及显示图表。
import matplotlib.pyplot as plt
from numpy.random import randn
plt.style.use('ggplot')
plot_data1=randn(50).cumsum()
plot_data2=randn(50).cumsum()
plot_data3=randn(50).cumsum()
plot_data4=randn(50).cumsum()
fig=plt.figure(1,figsize=(10,8),facecolor="white")
ax=fig.add_subplot(1,1,1)
ax.spines["left"].set_color("white")
ax.spines["bottom"].set_color("white")
ax.plot(plot_data1,marker=r'o',markersize=4,markeredgecolor='black',color=u'blue',linestyle='-',label='Blue Solid')
ax.plot(plot_data2,marker=r'+',color=u'red',linestyle='--',label='Red Dash')
ax.plot(plot_data3,marker=r'*',color=u'green',linestyle='-.',label='Green Dash Dot')
ax.plot(plot_data4,marker=r's',color=u'orange',linestyle=':',label='Orange Dotted')
ax.xaxis.set_ticks_position('bottom')
ax.yaxis.set_ticks_position('left')
plt.title('Line Plots:Markers,Colors,and Linestyles')
plt.xlabel('Draw')
plt.ylabel('Random Number')
plt.legend(loc='best')
plt.grid()
plt.savefig('E:\python\慕课网 python\.idea\photo\line_plot.png',dpi=400,bbox_inches='tight')
plt.show()


 731
731

 被折叠的 条评论
为什么被折叠?
被折叠的 条评论
为什么被折叠?
 到【灌水乐园】发言


