


一、安装Docker
CentOS系统中安装Docker
(一)首先卸载可能在已经安装的旧版本的Docker
sudo yum remove docker docker-common docker-selinux docker-engine(二)安装依赖包
sudo yum install -y yum-utils device-mapper-persistent-data lvm2(三)安装Docker源
sudo yum-config-manager --add-repo https://download.docker.com/linux/centos/docker-ce.repo
(四)安装Docker
sudo yum install docker-ce docker-ce-cli containerd.io(五)启动Docker服务
sudo systemctl start docker

#验证是否安装成功
docker --version
二、安装docker-compose
(一)Docker compose是什么
我们运行一个镜像的时候需要编写DockerFlie,docker build,docker run等命令操作容器。然而微服务架构的应用系统一般包含若干个微服务,每个微服务一般都会部署多个实例,如果每个微服务都要手动启停,那么效率之低,维护量之大
使用 Docker Compose 可以轻松、高效的管理容器,Docker Compose 是一个用于定义和运行多容器 Docker 应用程序的工具。它通过一个 YAML 文件(默认为 docker-compose.yml)来定义构成应用程序的多个服务及其网络、卷等依赖关系。
使用 Docker Compose 可以通过一个简单的命令(如 docker-compose up)来启动、停止和重建整个应用环境,大大简化了多容器应用的部署和管理流程。
Docker Compose 适合于单主机或多主机(但非集群化)环境下的应用部署,适用于开发、测试及小型生产环境
(二)安装Docker-Compose
Docker-Compose可以通过二进制安装的方式进行安装
# 下载Docker-Compose二进制文件
curl -L "https://github.com/docker/compose/releases/download/v2.6.1/docker-compose-$(uname -s)-$(uname -m)" -o /usr/local/bin/docker-compose


# 添加执行权限
chmod +x /usr/local/bin/docker-compose

# 验证安装是否成功
docker-compose --version
三、LPG日志收集方案(Loki+Grafana+Promtail)
LPG日志收集方案内存占用很少,经济且高效!它不像ELK日志系统那样为日志建立索引,而是为每个日志流设置一组标签。下面分别介绍下它的核心组件:
- Promtail:日志收集器,有点像Filebeat,可以收集日志文件中的日志,并把收集到的数据推送到Loki中去。
- Loki:聚合并存储日志数据,可以作为Grafana的数据源,为Grafana提供可视化数据。
- Grafana:从Loki中获取日志信息,进行可视化展示
三、创建文件夹以及配置文件
先上我的文件目录
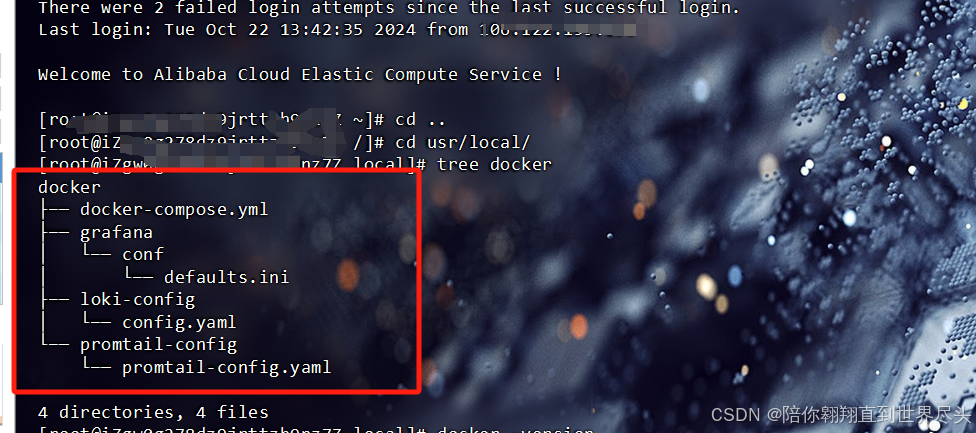
(一)创建文件夹
#在usr/local下创建目录
mkdir docker

#在docker目录下再创建loki,promtail,以及grafana文件夹
mkdir {loki-config,promtail-config,grafana}

#在grafana下再建一个conf
cd /usr/local/docker/grafana
mkdir conf
(二)创建docker-compose.yml文件
#打开docker目录
cd /usr/local/docker

#创建配置文件
vim docker-compose.yml
docker-compose.yml配置如下:
version: '3.7'

services:
  loki:
    image: grafana/loki  #镜像
    ports:
      - "3100:3100"       #宿主机端口:镜像的端口
    command: -config.file=/etc/loki/local-config.yaml -config.expand-env=true
    volumes:
           #宿主机配置文件:镜像配置文件
      - ./loki-config/config.yaml:/etc/loki/local-config.yaml

  promtail:
    image: grafana/promtail
    volumes:
      - /fzwy/test-pc-admin-api/log:/fzwy/test-pc-admin-api/log

         #宿主机配置文件路径:镜像配置文件路径
      - ./promtail-config/promtail-config.yaml:/etc/promtail/promtail-config.yaml
    command: -config.file=/etc/promtail/promtail-config.yaml

  grafana:
    image: grafana/grafana
    ports:
      - "3000:3000"
    environment:
      - GF_SECURITY_ADMIN_PASSWORD=admin
    volumes:
      - grafana-storage:/var/lib/grafana

volumes:
  grafana-storage:
(三)创建loki的配置文件
#打开docker下的loki目录
cd /usr/local/docker/loki-config

#创建配置文件
vim  config.yaml
loki的配置如下:
auth_enabled: false

server:
  http_listen_port: 3100
  grpc_listen_port: 9095

ingester:
  lifecycler:
    ring:
      kvstore:
        store: inmemory
      replication_factor: 1
  chunk_idle_period: 5m
  chunk_retain_period: 30s
  wal:
    dir: /loki/.cache/loki/wal

schema_config:
  configs:
    - from: 2020-10-24
      store: boltdb
      object_store: filesystem
      schema: v11
      index:
        prefix: index_
        period: 24h

storage_config:
  boltdb:
    directory: /loki/index

  filesystem:
    directory: /loki/chunks

limits_config:
  allow_structured_metadata: false
  reject_old_samples_max_age: 168h
  ingestion_rate_strategy: local
  # 每个用户每秒的采样率限制
  ingestion_rate_mb: 15
  # 每个用户允许的采样突发大小
  ingestion_burst_size_mb: 20


table_manager:
  retention_deletes_enabled: false
  retention_period: 0s
(四)创建granfana的默认配置defaults.ini
#打开docker目录
cd /usr/local/docker/grafana/conf

#创建配置文件
vim defaults.ini
defaults.ini配置如下,可以下载一下资源:
##################### Grafana Configuration Defaults #####################
#
# Do not modify this file in grafana installs
#

# possible values : production, development
app_mode = production

# instance name, defaults to HOSTNAME environment variable value or hostname if HOSTNAME var is empty
instance_name = ${HOSTNAME}

#################################### Paths ###############################
[paths]
# Path to where grafana can store temp files, sessions, and the sqlite3 db (if that is used)
data = data

# Temporary files in `data` directory older than given duration will be removed
temp_data_lifetime = 24h

# Directory where grafana can store logs
logs = data/log

# Directory where grafana will automatically scan and look for plugins
plugins = data/plugins

# folder that contains provisioning config files that grafana will apply on startup and while running.
provisioning = conf/provisioning

#################################### Server ##############################
[server]
default_locale = zh-CN
# Protocol (http, https, h2, socket)
protocol = http

# The ip address to bind to, empty will bind to all interfaces
http_addr =

# The http port to use
http_port = 3000

# The public facing domain name used to access grafana from a browser
domain = localhost

# Redirect to correct domain if host header does not match domain
# Prevents DNS rebinding attacks
enforce_domain = false

# The full public facing url
root_url = %(protocol)s://%(domain)s:%(http_port)s/

# Serve Grafana from subpath specified in `root_url` setting. By default it is set to `false` for compatibility reasons.
serve_from_sub_path = false

# Log web requests
router_logging = false

# the path relative working path
static_root_path = public

# enable gzip
enable_gzip = false

# https certs & key file
cert_file =
cert_key =

# Unix socket path
socket = /tmp/grafana.sock

# CDN Url
cdn_url =

# Sets the maximum time in minutes before timing out read of an incoming request and closing idle connections.
# `0` means there is no timeout for reading the request.
read_timeout = 0

#################################### Database ############################
[database]
# You can configure the database connection by specifying type, host, name, user and password
# as separate properties or as on string using the url property.

# Either "mysql", "postgres" or "sqlite3", it's your choice
type = sqlite3
host = 127.0.0.1:3306
name = grafana
user = root
# If the password contains # or ; you have to wrap it with triple quotes. Ex """#password;"""
password =
# Use either URL or the previous fields to configure the database
# Example: mysql://user:secret@host:port/database
url =

# Max idle conn setting default is 2
max_idle_conn = 2

# Max conn setting default is 0 (mean not set)
max_open_conn =

# Connection Max Lifetime default is 14400 (means 14400 seconds or 4 hours)
conn_max_lifetime = 14400

# Set to true to log the sql calls and execution times.
log_queries =

# For "postgres", use either "disable", "require" or "verify-full"
# For "mysql", use either "true", "false", or "skip-verify".
ssl_mode = disable

# Database drivers may support different transaction isolation levels.
# Currently, only "mysql" driver supports isolation levels.
# If the value is empty - driver's default isolation level is applied.
# For "mysql" use "READ-UNCOMMITTED", "READ-COMMITTED", "REPEATABLE-READ" or "SERIALIZABLE".
isolation_level =

ca_cert_path =
client_key_path =
client_cert_path =
server_cert_name =

# For "sqlite3" only, path relative to data_path setting
path = grafana.db

# For "sqlite3" only. cache mode setting used for connecting to the database
cache_mode = private

#################################### Cache server #############################
[remote_cache]
# Either "redis", "memcached" or "database" default is "database"
type = database

# cache connectionstring options
# database: will use Grafana primary database.
# redis: config like redis server e.g. `addr=127.0.0.1:6379,pool_size=100,db=0,ssl=false`. Only addr is required. ssl may be 'true', 'false', or 'insecure'.
# memcache: 127.0.0.1:11211
connstr =

#################################### Data proxy ######
最低0.47元/天 解锁文章


 1894
1894

 被折叠的 条评论
为什么被折叠?
被折叠的 条评论
为什么被折叠?
 到【灌水乐园】发言


