


 本文介绍了EllipticEnvelope算法,该算法通过假设数据遵循特定概率分布来确定边界,识别异常点。在 sklearn 中,可以通过 `EllipticEnvelope` 类实现该算法。文中提供了一个简单的代码示例,并展示了如何使用该算法进行可视化,通过在葡萄酒数据集上应用不同类型的异常检测器,如 EmpiricalCovariance 和 OneClassSVM,描绘出数据点的分布边界。
Elliptic Envelope
算法思想
Elliptic Envelope算法的思路是,假设常规数据隐含这一个已知的概率分布。基于这个假设,我们尝试确定数据的形状(边界),也可以将远离边界的样本点定义为异常点。SKlearn提供了一个covariance.EllipticEnvelope类,它可以根据数据做一个鲁棒的协方差估计,然后学习到一个包围中心样本点并忽视离群点的椭圆。
代码实现
使用sklearn中的相关包来实现Elliptic Envelope算法,举一个很简单的小demo:
from sklearn.covariance import EllipticEnvelope
X = [[0], [0.44], [0.45], [0.46], [1]]
clf = EllipticEnvelope(random_state=0)
clf = clf.fit(X)
# score越小,代表越有可能是离群点
scores = clf.score_samples(X)
"""
输出的结果是:
[-3.0375e+03 -1.5000e+00 -0.0000e+00 -1.5000e+00 -4.5375e+03]
"""
print(scores)
其他的内置函数以及介绍在:scikit-learn
可视化
sklearn上的可视化案例,链接为:scikit-learn
import numpy as np
from sklearn.covariance import EllipticEnvelope
from sklearn.svm import OneClassSVM
import matplotlib.pyplot as plt
import matplotlib.font_manager
from sklearn.datasets import load_wine
# Define "classifiers" to be used
classifiers = {
"Empirical Covariance": EllipticEnvelope(support_fraction=1.,
contamination=0.25),
"Robust Covariance (Minimum Covariance Determinant)":
EllipticEnvelope(contamination=0.25),
"OCSVM": OneClassSVM(nu=0.25, gamma=0.35)}
colors = ['m', 'g', 'b']
legend1 = {}
legend2 = {}
# Get data
X1 = load_wine()['data'][:, [1, 2]] # two clusters
# Learn a frontier for outlier detection with several classifiers
xx1, yy1 = np.meshgrid(np.linspace(0, 6, 500), np.linspace(1, 4.5, 500))
for i, (clf_name, clf) in enumerate(classifiers.items()):
plt.figure(1)
clf.fit(X1)
Z1 = clf.decision_function(np.c_[xx1.ravel(), yy1.ravel()])
Z1 = Z1.reshape(xx1.shape)
legend1[clf_name] = plt.contour(
xx1, yy1, Z1, levels=[0], linewidths=2, colors=colors[i])
legend1_values_list = list(legend1.values())
legend1_keys_list = list(legend1.keys())
# Plot the results (= shape of the data points cloud)
plt.figure(1) # two clusters
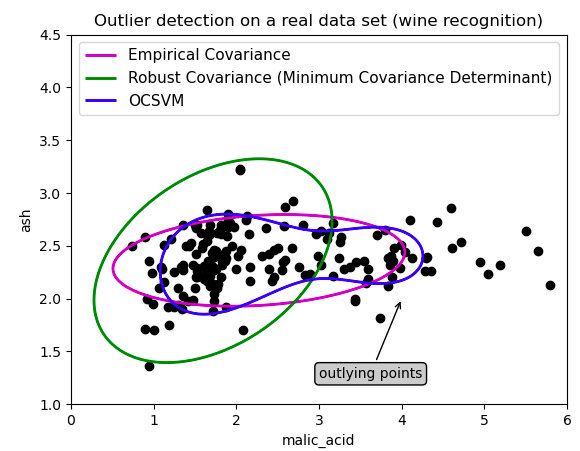
plt.title("Outlier detection on a real data set (wine recognition)")
plt.scatter(X1[:, 0], X1[:, 1], color='black')
bbox_args = dict(boxstyle="round", fc="0.8")
arrow_args = dict(arrowstyle="->")
plt.annotate("outlying points", xy=(4, 2),
xycoords="data", textcoords="data",
xytext=(3, 1.25), bbox=bbox_args, arrowprops=arrow_args)
plt.xlim((xx1.min(), xx1.max()))
plt.ylim((yy1.min(), yy1.max()))
plt.legend((legend1_values_list[0].collections[0],
legend1_values_list[1].collections[0],
legend1_values_list[2].collections[0]),
(legend1_keys_list[0], legend1_keys_list[1], legend1_keys_list[2]),
loc="upper center",
prop=matplotlib.font_manager.FontProperties(size=11))
plt.ylabel("ash")
plt.xlabel("malic_acid")
plt.show()
最终的结果是:


 333
333

 被折叠的 条评论
为什么被折叠?
被折叠的 条评论
为什么被折叠?
 到【灌水乐园】发言


