


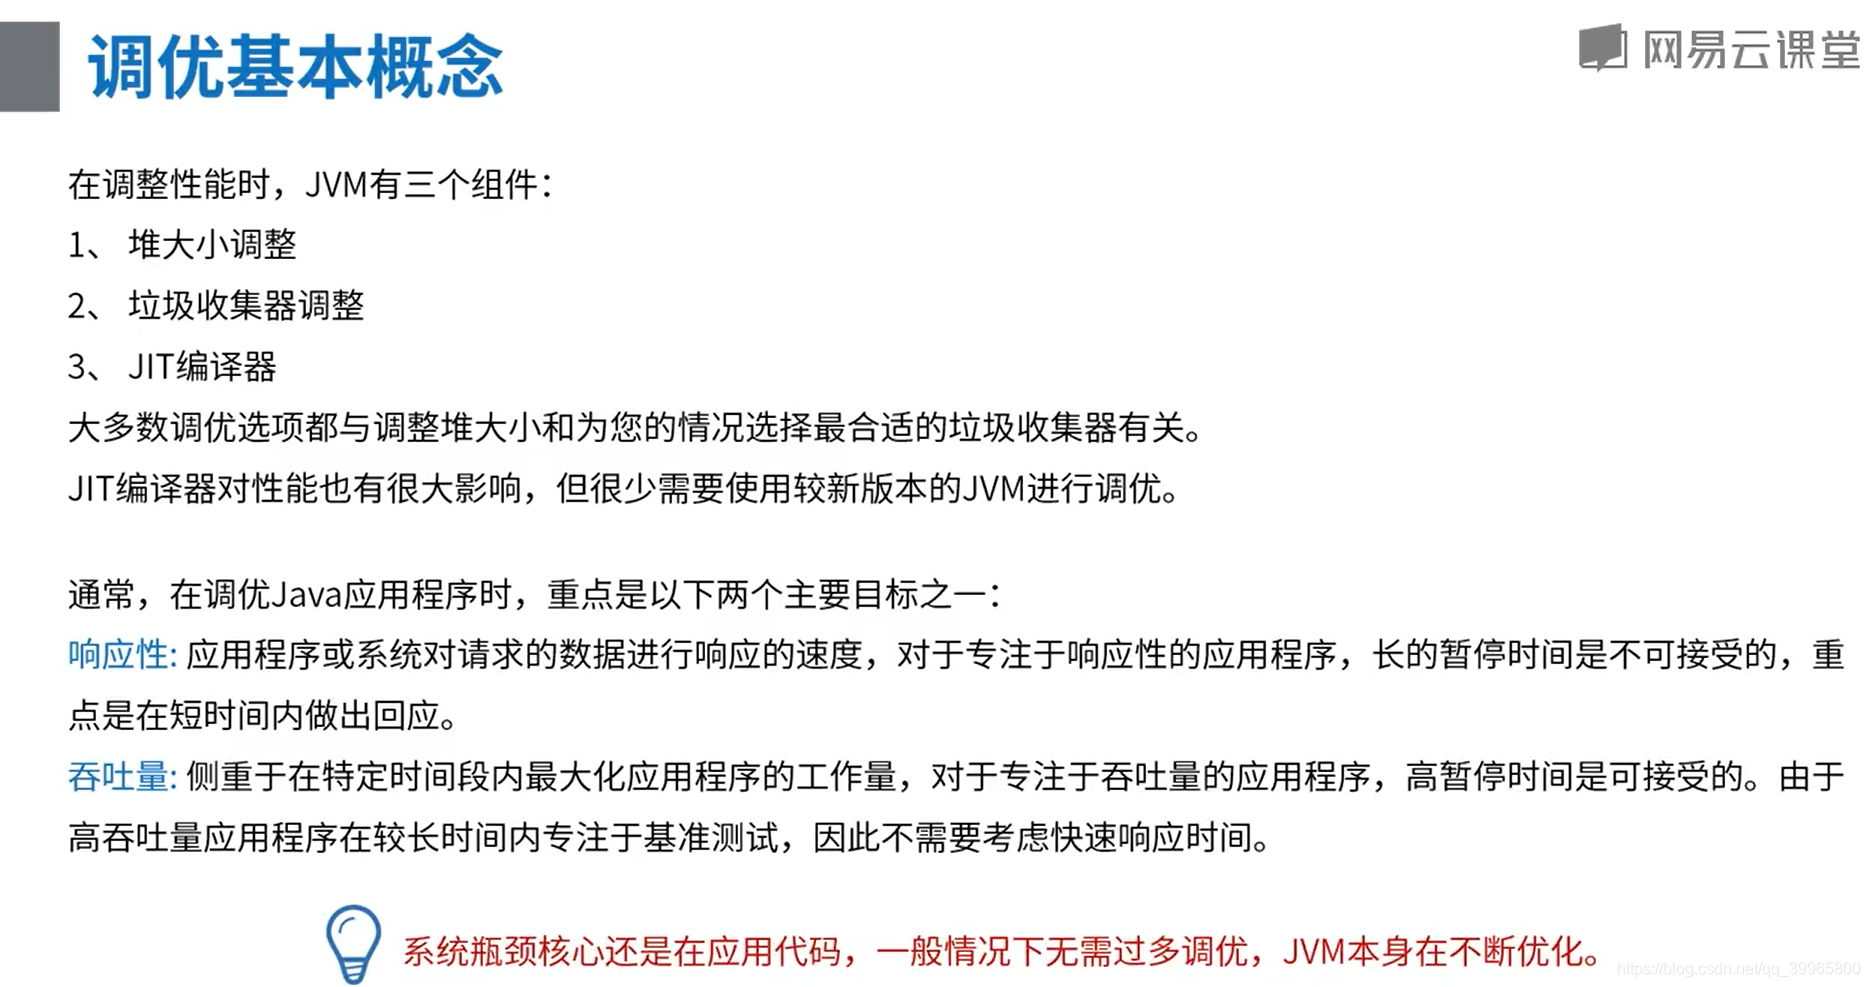
 本文通过一个Java应用示例,演示了如何进行性能优化和垃圾收集器(GC)调优。首先,模拟高并发场景,观察GC情况。接着尝试了不同的JVM参数,如增加并行GC线程、限制最大GC暂停时间、使用CMS回收器、调整G1垃圾收集器的线程数和分区大小等。强调GC调优是一个逐步调试过程,需要结合系统需求和监控。最后指出,性能问题主要源于业务代码,无监控则无法有效调优。
package com.study.performance;
import org.springframework.boot.SpringApplication;
import org.springframework.boot.autoconfigure.SpringBootApplication;
import java.util.Random;
import java.util.concurrent.Executors;
import java.util.concurrent.TimeUnit;
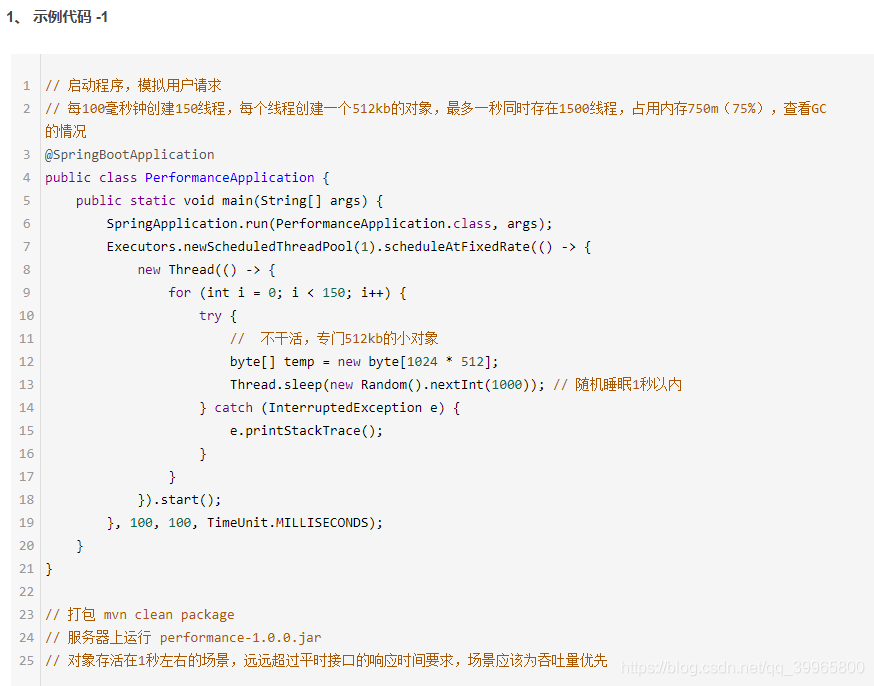
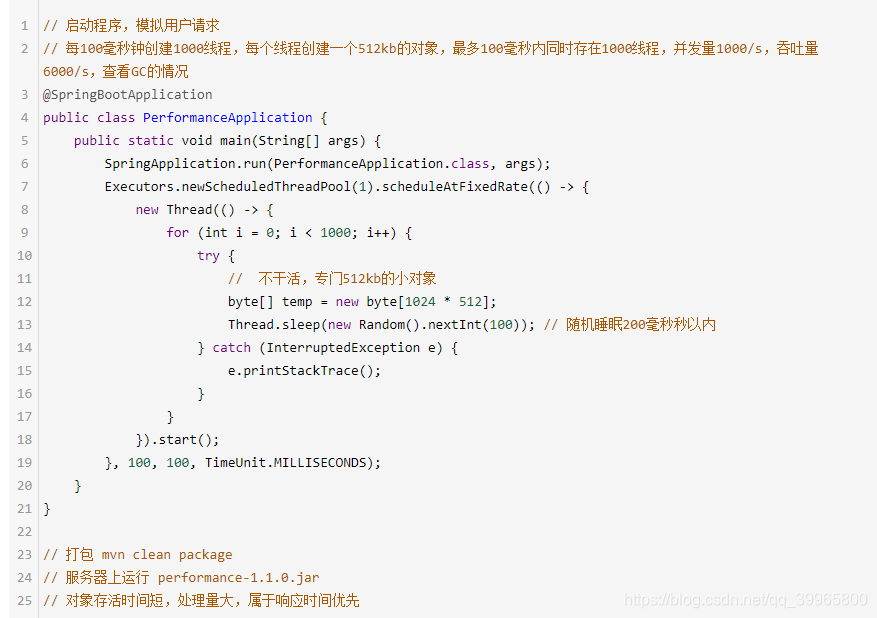
// 启动程序,模拟用户请求
// 每100毫秒钟创建1000线程,每个线程创建一个512kb的对象,最多100毫秒内同时存在1000线程,并发量1000/s,吞吐量6000/s,查看GC的情况
@SpringBootApplication
public class PerformanceApplication {
public static void main(String[] args) {
SpringApplication.run(PerformanceApplication.class, args);
Executors.newScheduledThreadPool(1).scheduleAtFixedRate(() -> {
new Thread(() -> {
for (int i = 0; i < 1000; i++) {
try {
// 不干活,专门512kb的小对象
byte[] temp = new byte[1024 * 512];
Thread.sleep(new Random().nextInt(100)); // 随机睡眠200毫秒秒以内
} catch (InterruptedException e) {
e.printStackTrace();
}
}
}).start();
}, 100, 100, TimeUnit.MILLISECONDS);
}
}
// 打包 mvn clean package
// 服务器上运行 performance-1.0.0.jar
//对象存活1秒的场景,远远超过平时接口的响应时间要求,场景应该是吞吐量优先

ivan@ivan-virtual-machine:~/Desktop$ jmap
Usage:
    jmap [option] <pid>
        (to connect to running process)
    jmap [option] <executable <core>
        (to connect to a core file)
    jmap [option] [server_id@]<remote server IP or hostname>
        (to connect to remote debug server)

where <option> is one of:
    <none>               to print same info as Solaris pmap
    -heap                to print java heap summary
    -histo[:live]        to print histogram of java object heap; if the "live"
                         suboption is specified, only count live objects
    -clstats             to print class loader statistics
    -finalizerinfo       to print information on objects awaiting finalization
    -dump:<dump-options> to dump java heap in hprof binary format
                         dump-options:
                           live         dump only live objects; if not specified,
                                        all objects in the heap are dumped.
                           format=b     binary format
                           file=<file>  dump heap to <file>
                         Example: jmap -dump:live,format=b,file=heap.bin <pid>
    -F                   force. Use with -dump:<dump-options> <pid> or -histo
                         to force a heap dump or histogram when <pid> does not
                         respond. The "live" suboption is not supported
                         in this mode.
    -h | -help           to print this help message
    -J<flag>             to pass <flag> directly to the runtime system

ivan@ivan-virtual-machine:~/Desktop$ jcmd
9476 sun.tools.jcmd.JCmd
8622 performance-1.1.0.jar

root@ivan-virtual-machine:/home/ivan/Desktop# jmap -heap 8622
Attaching to process ID 8622, please wait...
Debugger attached successfully.
Server compiler detected.
JVM version is 25.242-b08

using thread-local object allocation.
Mark Sweep Compact GC

Heap Configuration:
   MinHeapFreeRatio         = 40
   MaxHeapFreeRatio         = 70
   MaxHeapSize              = 1073741824 (1024.0MB)
   NewSize                  = 11141120 (10.625MB)
   MaxNewSize               = 357892096 (341.3125MB)
   OldSize                  = 22413312 (21.375MB)
   NewRatio                 = 2
   SurvivorRatio            = 8
   MetaspaceSize            = 21807104 (20.796875MB)
   CompressedClassSpaceSize = 1073741824 (1024.0MB)
   MaxMetaspaceSize         = 17592186044415 MB
   G1HeapRegionSize         = 0 (0.0MB)

Heap Usage:
Exception in thread "main" java.lang.reflect.InvocationTargetException
	at sun.reflect.NativeMethodAccessorImpl.invoke0(Native Method)
	at sun.reflect.NativeMethodAccessorImpl.invoke(NativeMethodAccessorImpl.java:62)
	at sun.reflect.DelegatingMethodAccessorImpl.invoke(DelegatingMethodAccessorImpl.java:43)
	at java.lang.reflect.Method.invoke(Method.java:498)
	at sun.tools.jmap.JMap.runTool(JMap.java:201)
	at sun.tools.jmap.JMap.main(JMap.java:130)
Caused by: java.lang.RuntimeException: unknown CollectedHeap type : class sun.jvm.hotspot.gc_interface.CollectedHeap
	at sun.jvm.hotspot.tools.HeapSummary.run(HeapSummary.java:144)
	at sun.jvm.hotspot.tools.Tool.startInternal(Tool.java:260)
	at sun.jvm.hotspot.tools.Tool.start(Tool.java:223)
	at sun.jvm.hotspot.tools.Tool.execute(Tool.java:118)
	at sun.jvm.hotspot.tools.HeapSummary.main(HeapSummary.java:49)
	... 6 more
java版本问题报错

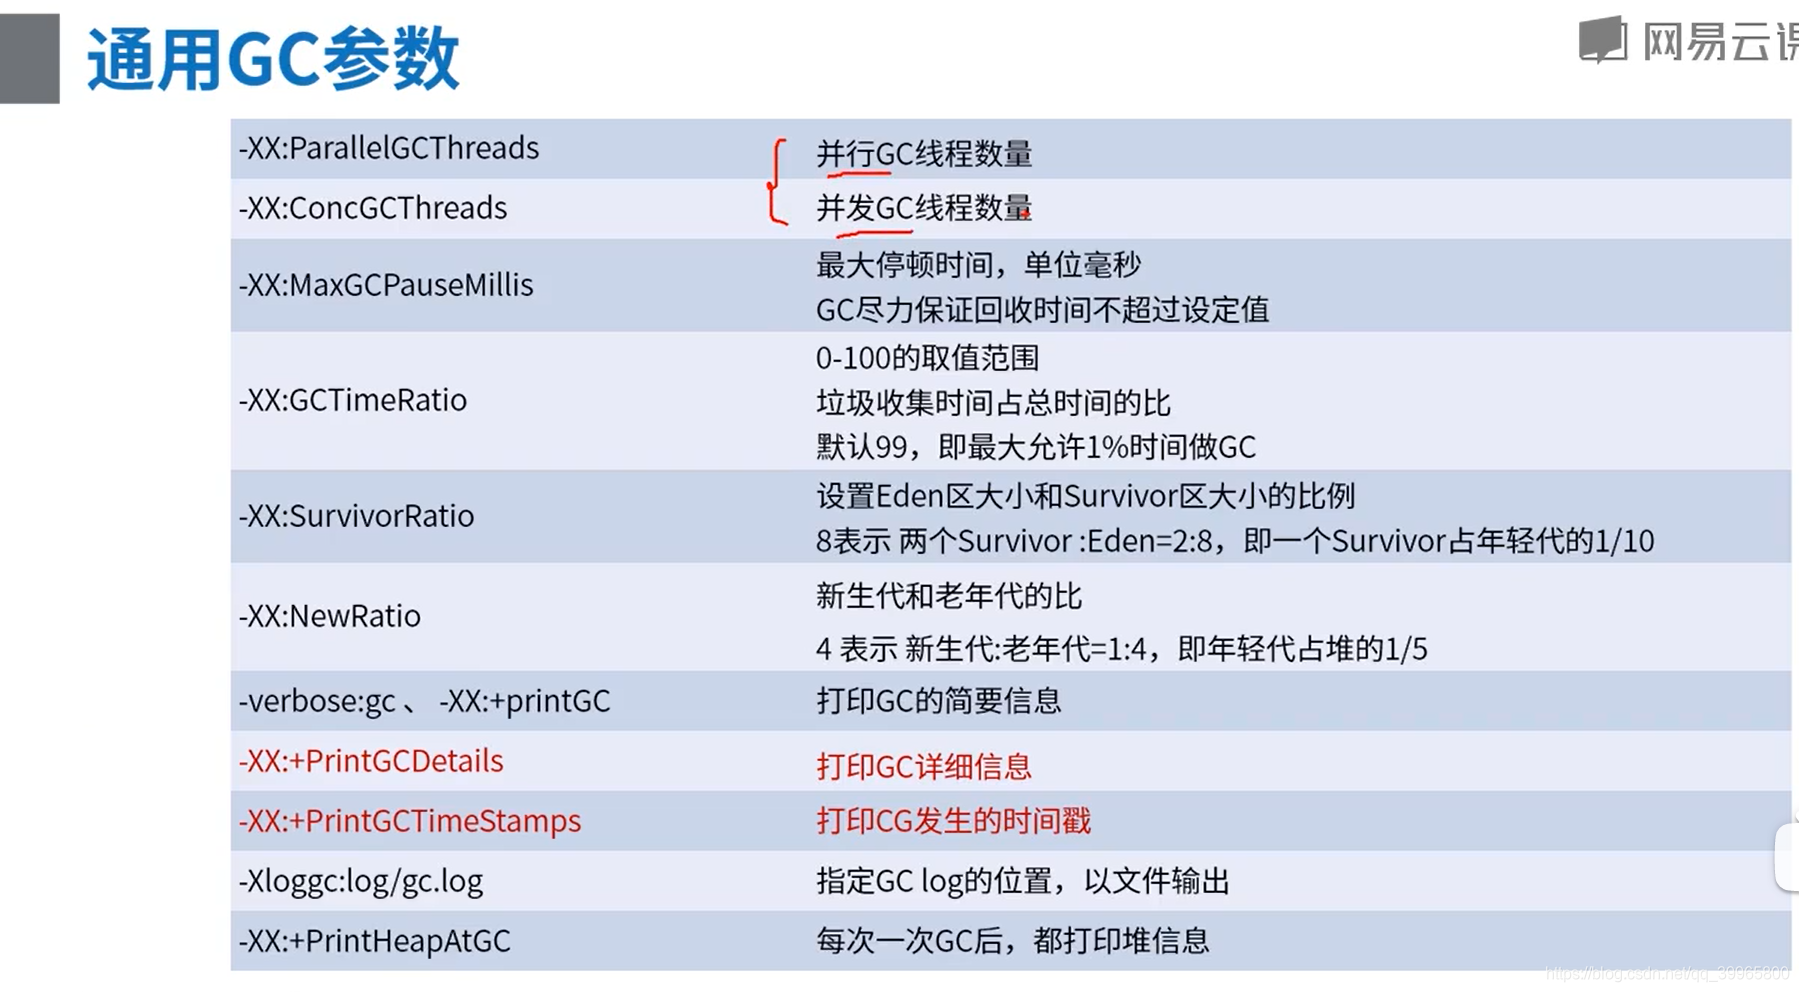
最大停顿时间是尽力保持,调整新生代和老年代的大小
GCTimeRatio也没啥用
SurvivorRatio也没啥用,自动会调整
案例
测试环境:JVM配置为2核1G,JAVA8,固定设置堆大小 1G
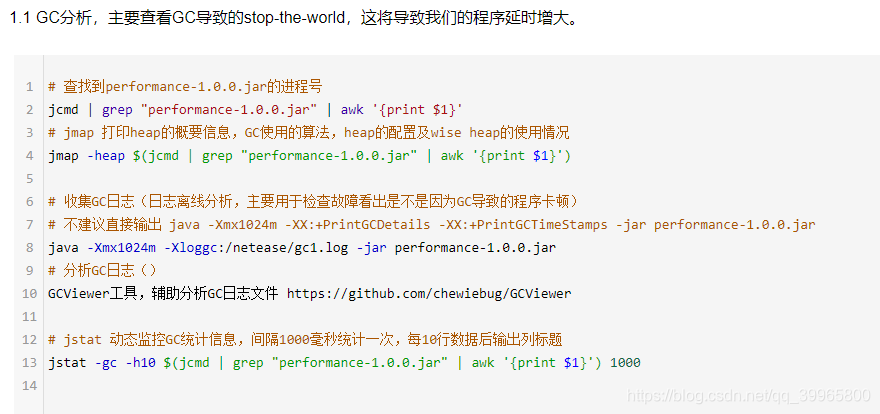


awk这个就是转换为字符串并且用空格进行分割,然后取得第一位
jinfo查看一下不是默认的参数
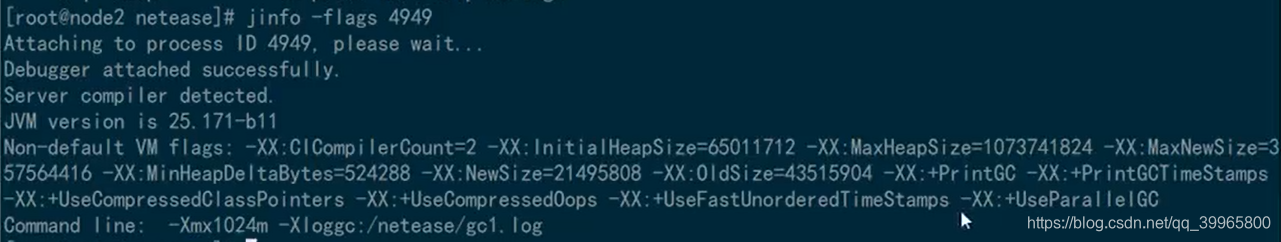
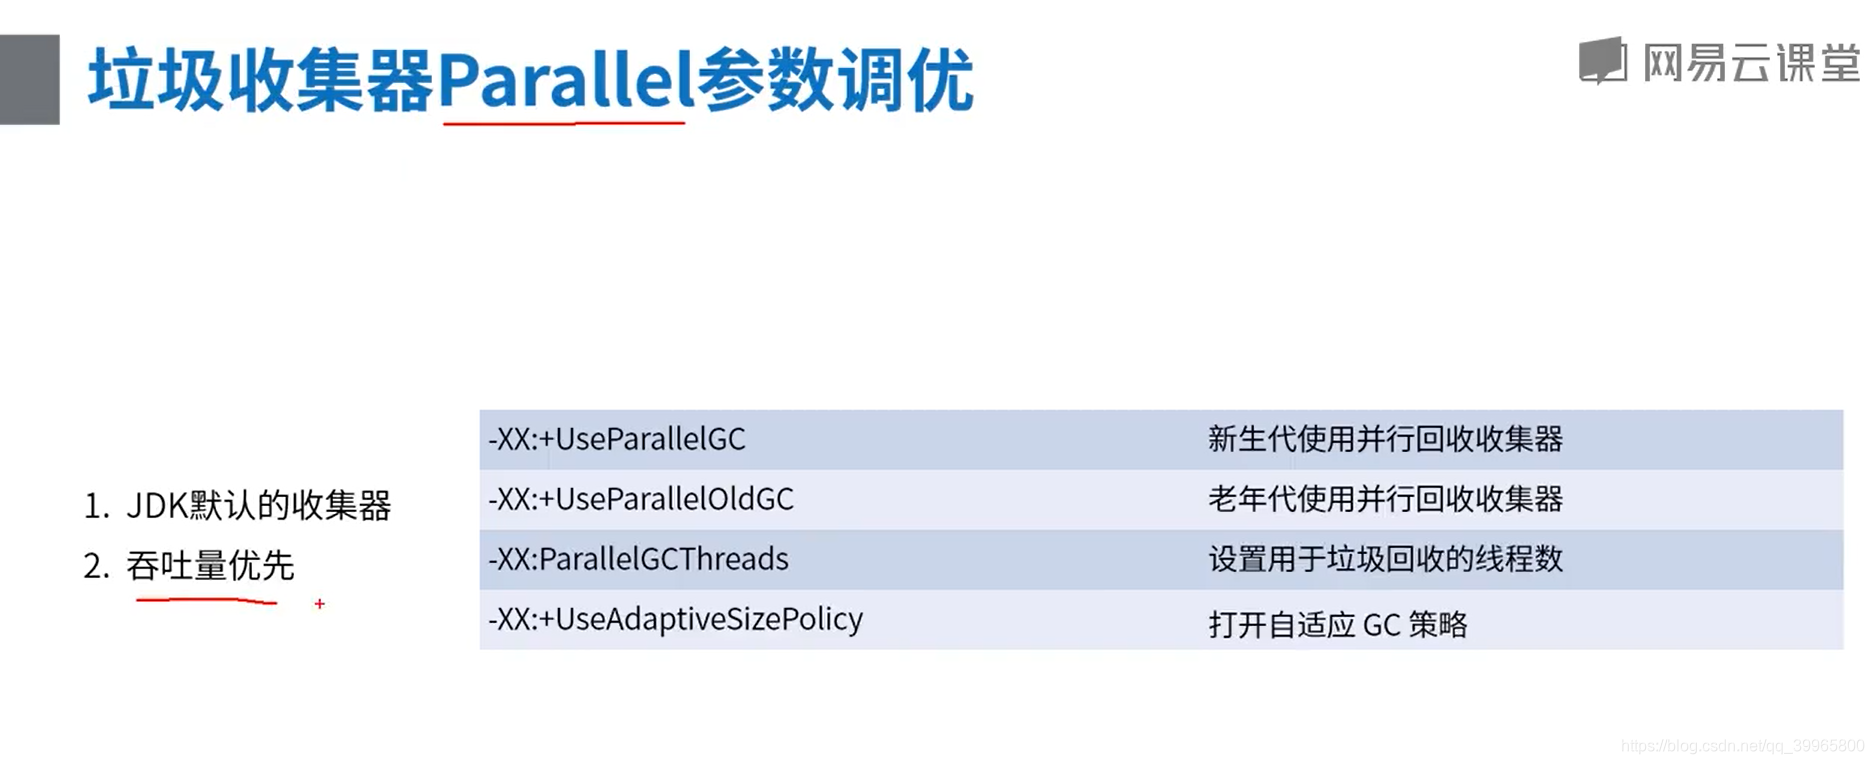
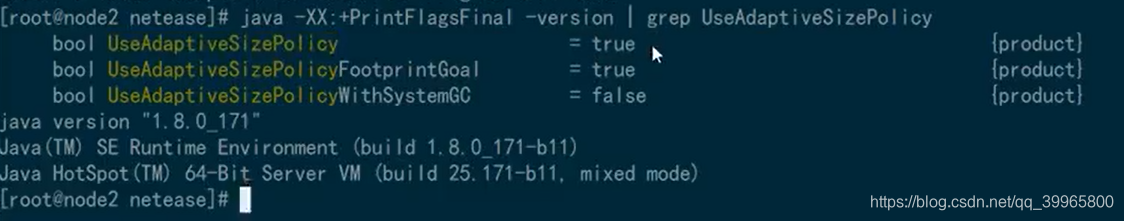
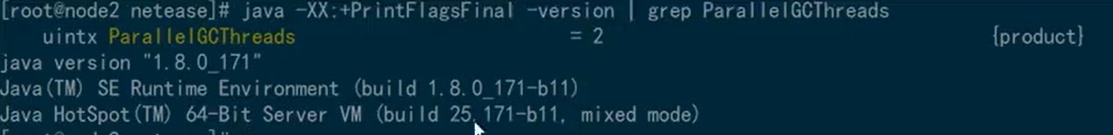
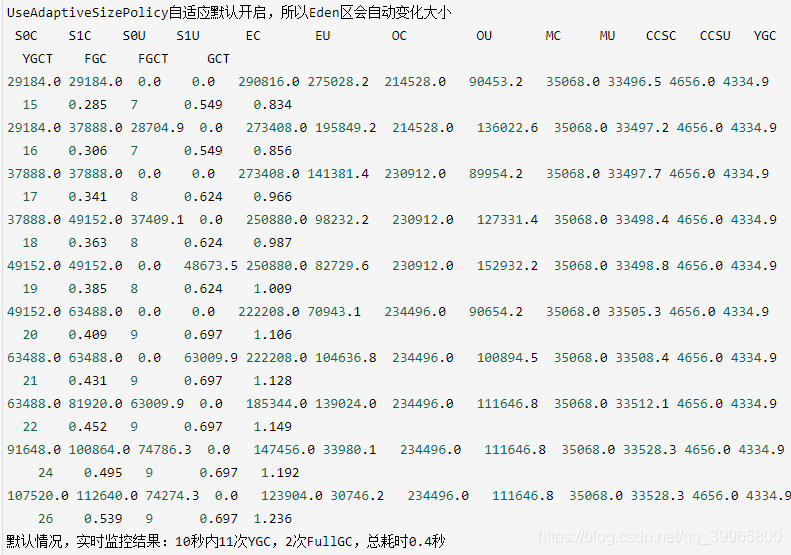
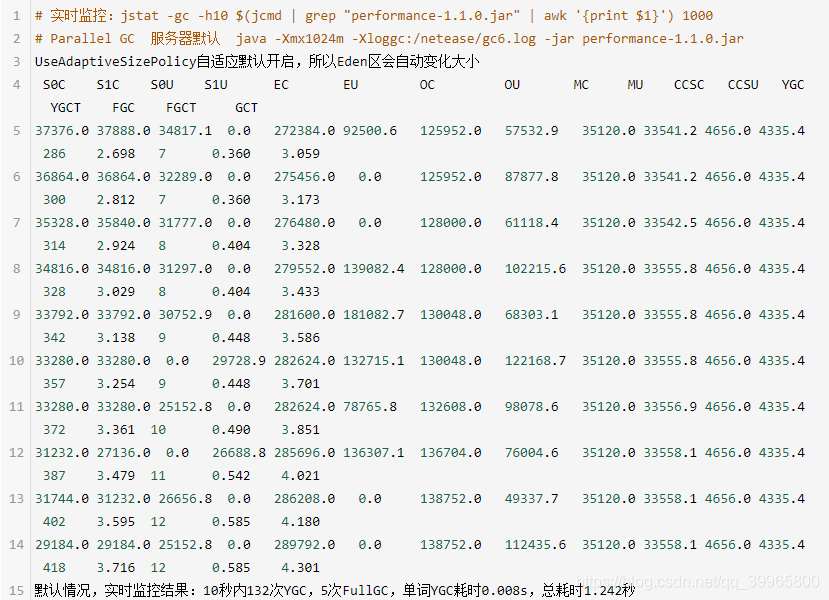
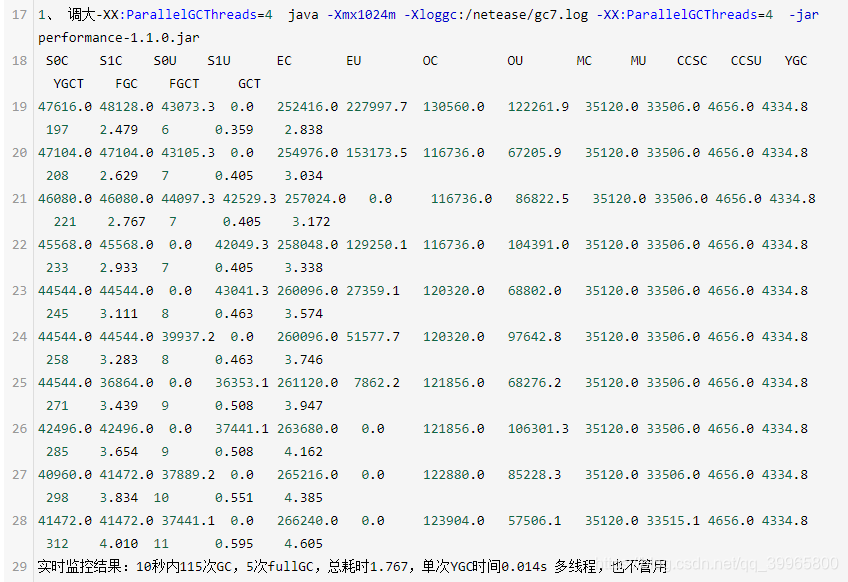
1、 调大-XX:ParallelGCThreads=4
java -Xmx1024m -Xloggc:/netease/gc2.log -XX:ParallelGCThreads=4 -jar performance-1.0.0.jar
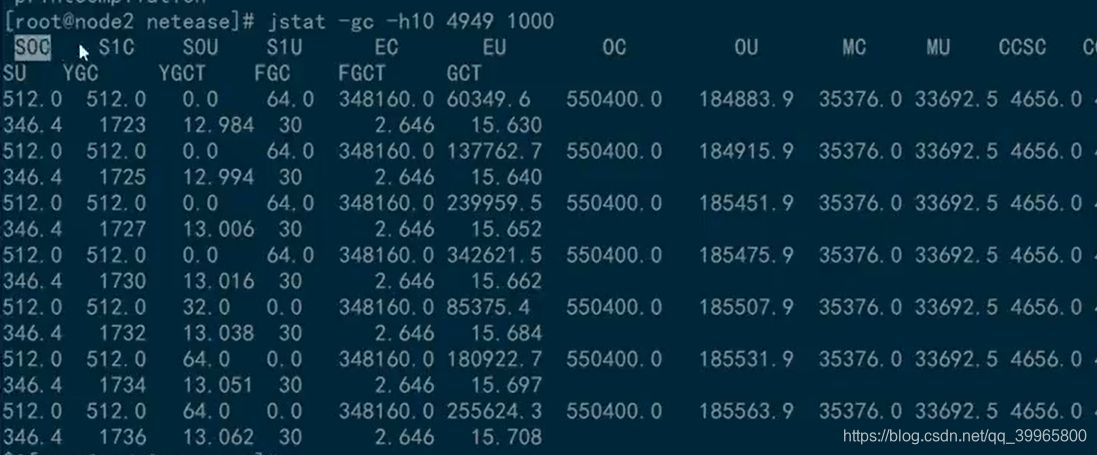
jstat -gc -h10 $(jcmd | grep "performance-1.0.0.jar" | awk '{print $1}') 1000
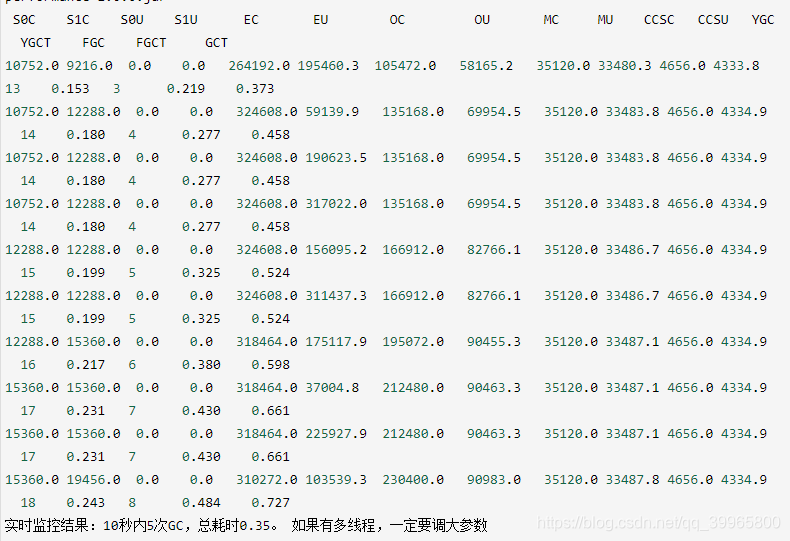
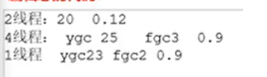
线程还是要和核数相同最优
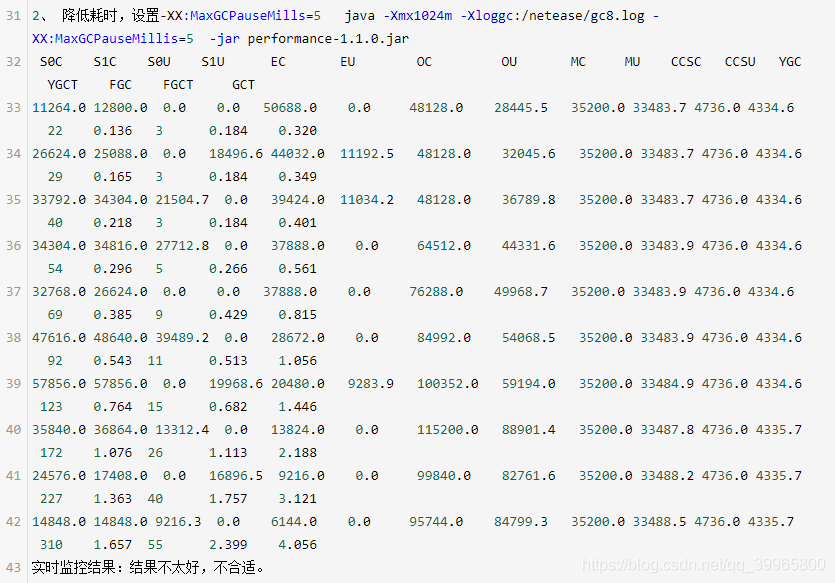
2、 降低耗时
设置-XX:MaxGCPauseMills=10
java -Xmx1024m -Xloggc:/netease/gc3.log -XX:MaxGCPauseMillis=10 -jar performance-1.0.0.jar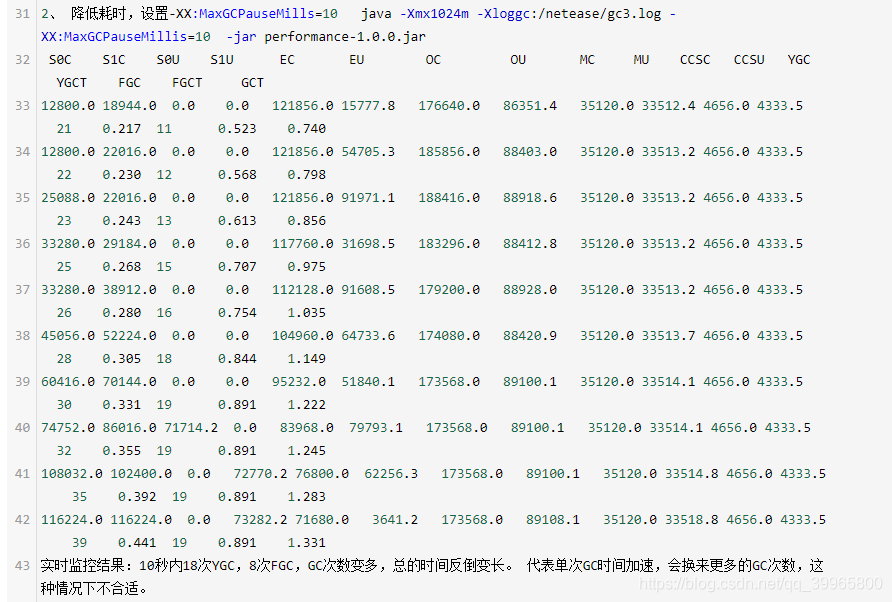
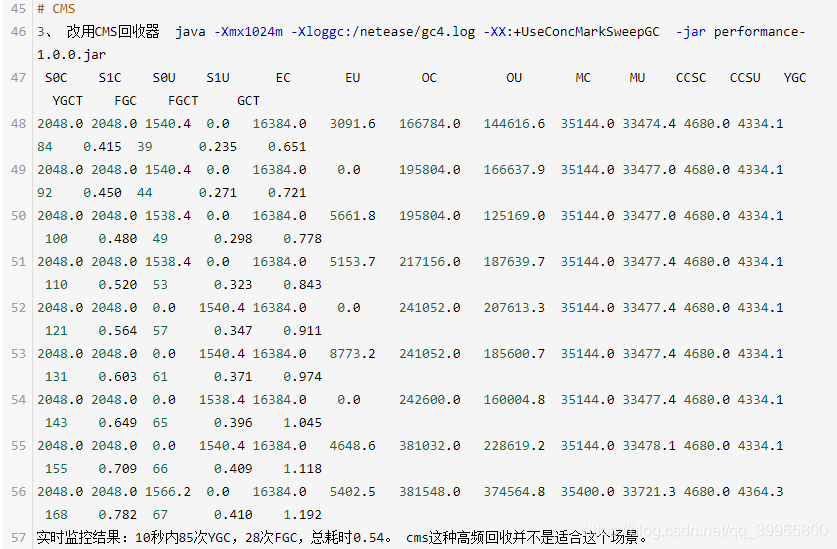
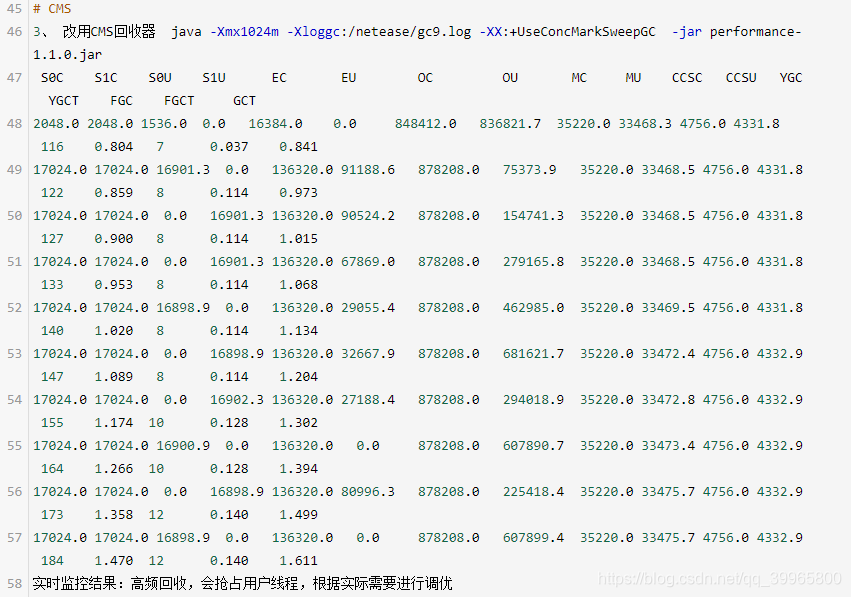
3、 改用CMS回收器
java -Xmx1024m -Xloggc:/netease/gc4.log -XX:+UseConcMarkSweepGC -jar performance-1.0.0.jar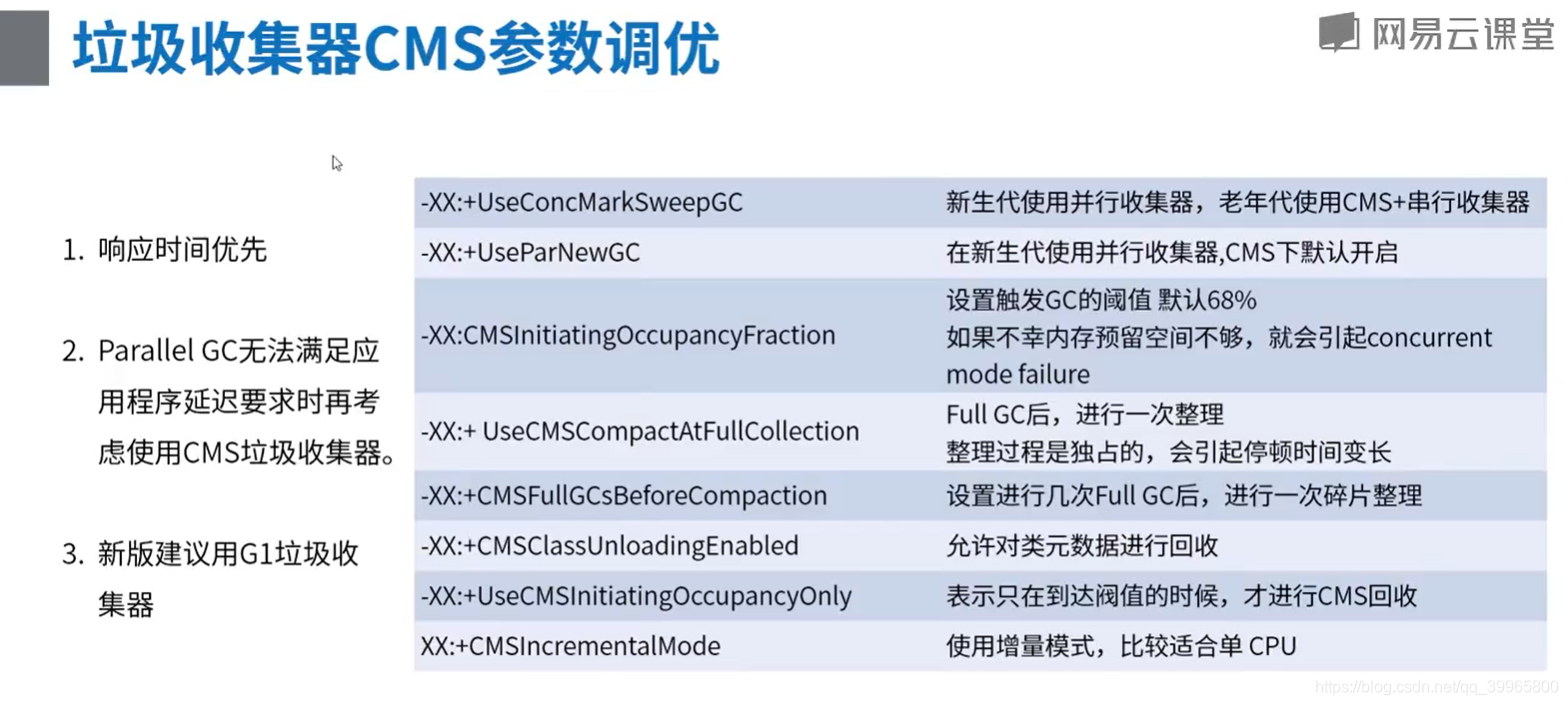
这个垃圾回收器不适用于吞吐量优先的情况。
https://docs.oracle.com/javase/8/
4、 增加线程
java -Xmx1024m -Xloggc:/netease/gc4.log -XX:+UseConcMarkSweepGC -XX:ConcGCThreads=3 -jar performance-1.0.0.jar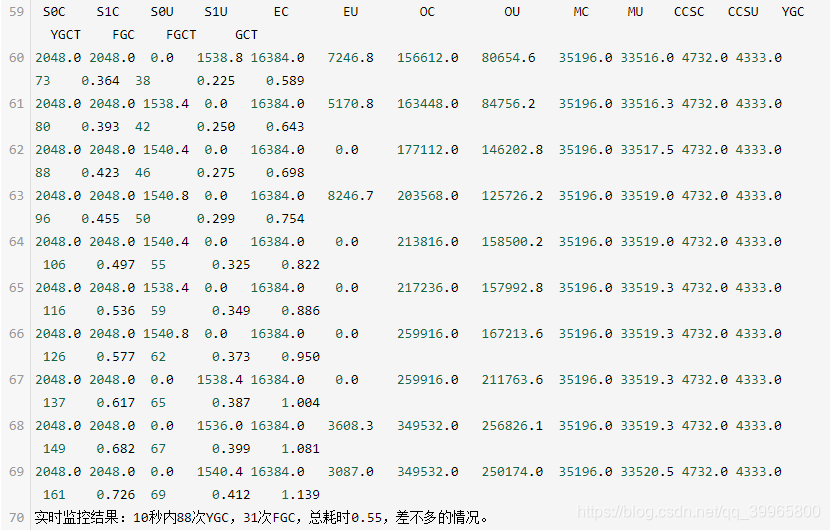
用户线程和GC线程,会和用户线程争抢cpu
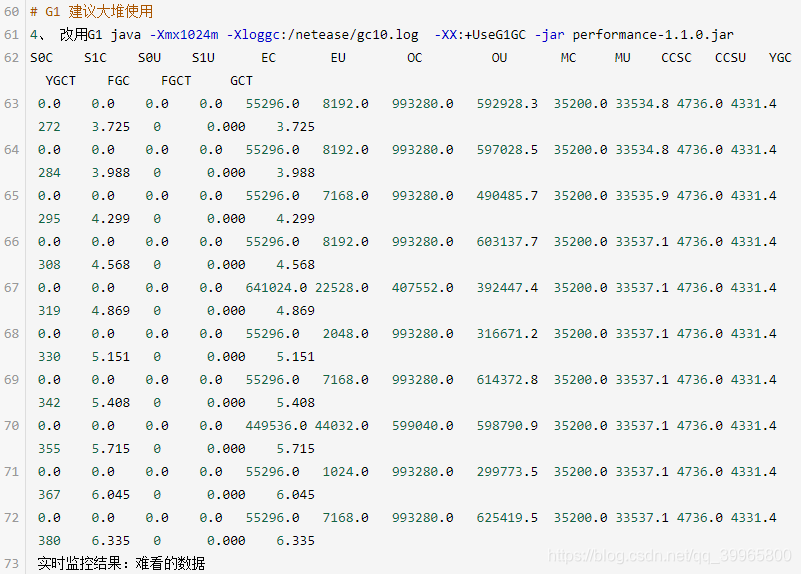
5、改用G1
java -Xmx1024m -Xloggc:/netease/gc10.log -XX:+UseG1GC -jar performance-1.0.0.jar 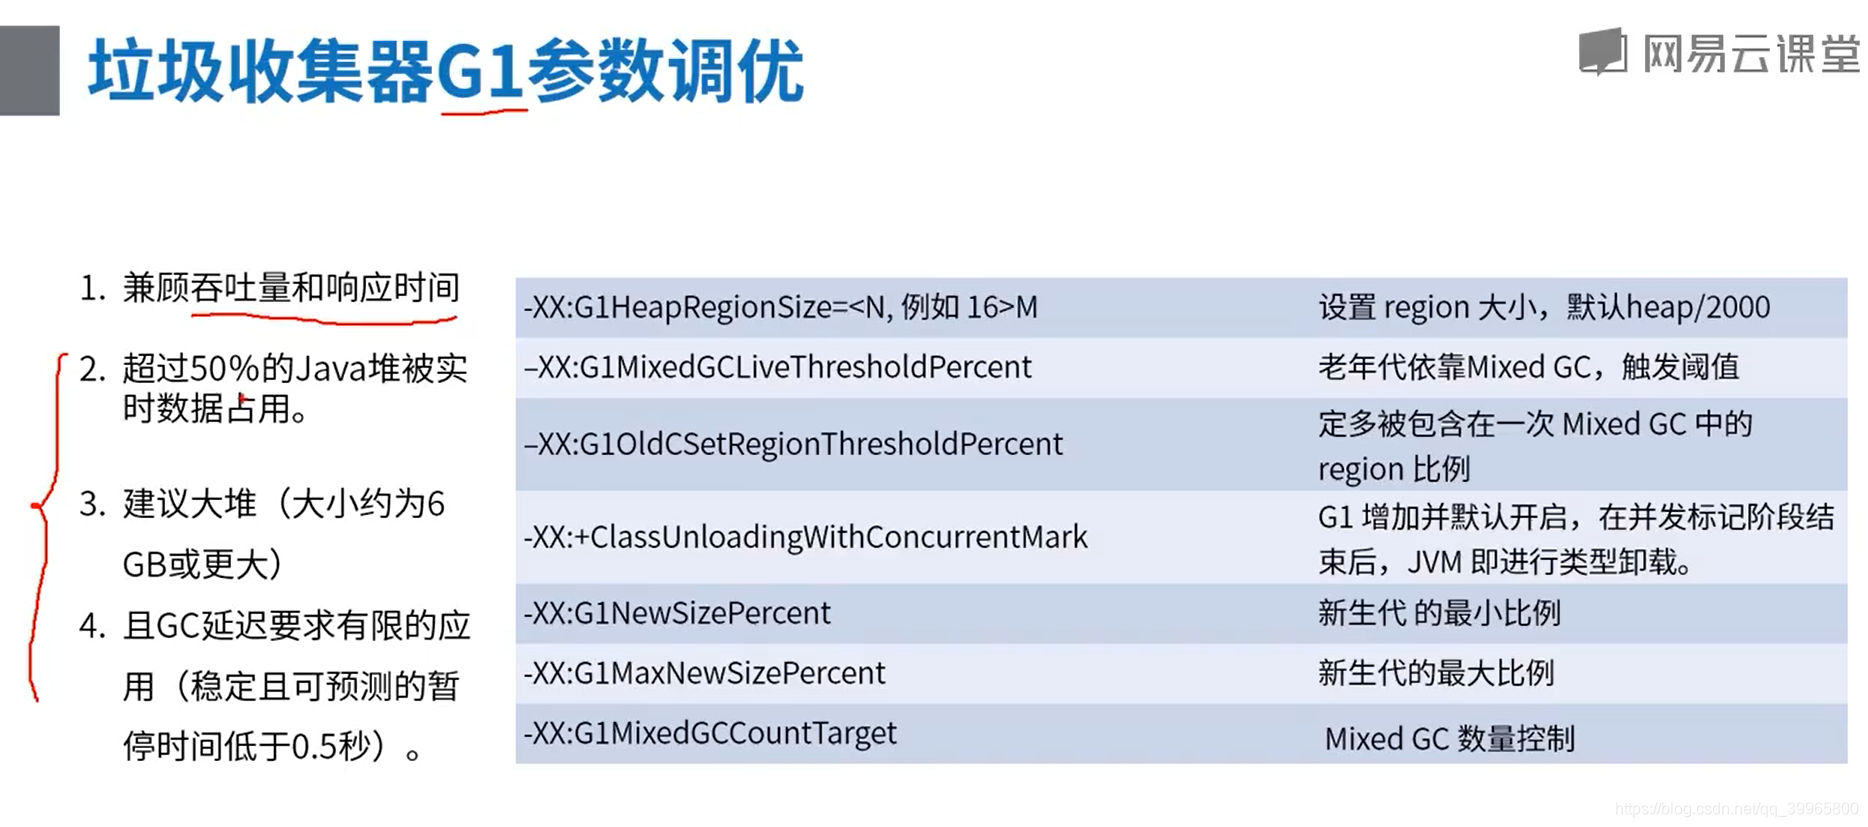
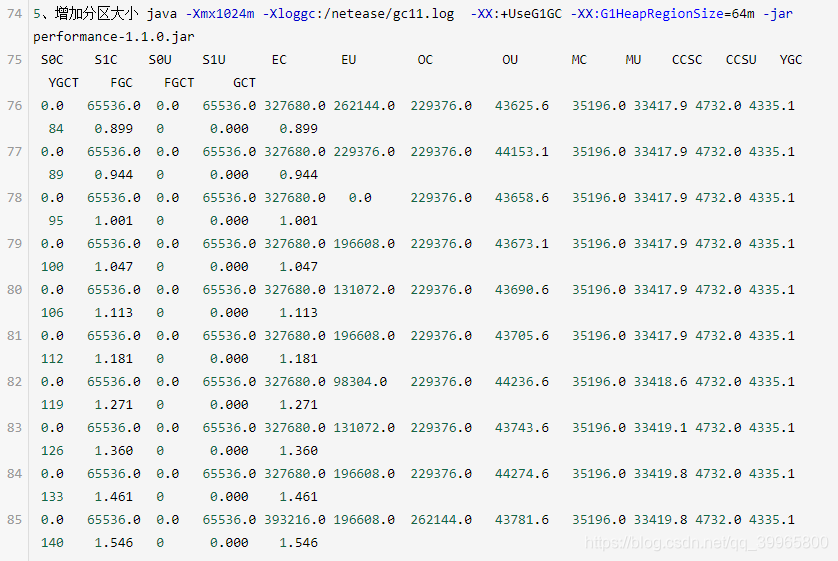
6、增加分区大小
java -Xmx1024m -Xloggc:/netease/gc11.log -XX:+UseG1GC -XX:G1HeapRegionSize=64m -jar performance-1.0.0.jar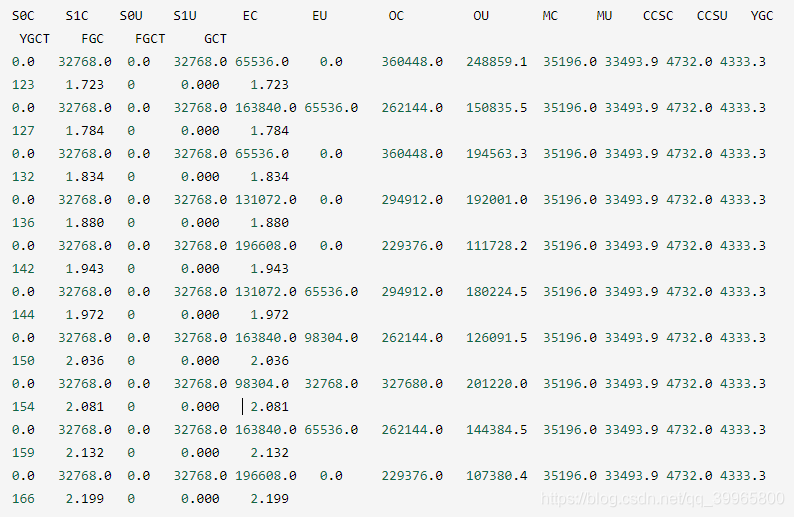
示例代码 -2
2.1 GC调优
3、 结语
主要是演示切换的过程和思路,实际还是要结合系统情况、系统需要来调整。
1、 GC调优就是逐步调试的过程,对每个参数的含义了解后,再根据官方手册,一个个调试,找到符合应用的最佳配置点。是一个细致活,难度高。
2、 再重复一句,性能问题,98.75%上是业务代码上面。
3、 无监控,不调优。


 1848
1848

 被折叠的 条评论
为什么被折叠?
被折叠的 条评论
为什么被折叠?
 到【灌水乐园】发言


