


- 算法实现
import heapq
import networkx as nx
import matplotlib.pyplot as plt


def dijkstra(graph, start, goal):
    distances = {node: float("infinity") for node in graph}
    distances[start] = 0
    parents = {node: None for node in graph}
    priority_queue = [(0, start)]

    while priority_queue:
        current_distance, current_node = heapq.heappop(priority_queue)

        if current_node == goal:
            break

        for neighbor, weight in graph[current_node].items():
            distance = current_distance + weight
            if distance < distances[neighbor]:
                distances[neighbor] = distance
                parents[neighbor] = current_node
                heapq.heappush(priority_queue, (distance, neighbor))

    path = []
    current_node = goal
    while current_node is not None:
        path.append(current_node)
        current_node = parents[current_node]
    path.reverse()

    return path, distances[goal]


# 示例图
graph = {
    "A": {"B": 1, "C": 4},
    "B": {"A": 1, "C": 2, "D": 5},
    "C": {"A": 4, "B": 2, "D": 1, "E": 2},
    "D": {"B": 5, "C": 1, "E": 3},
    "E": {"D": 3, "C": 2},
}

start_node = "A"
goal_node = "E"
shortest_path, shortest_distance = dijkstra(graph, start_node, goal_node)

print("从节点 {} 到节点 {} 的最短路径: {}".format(start_node, goal_node, shortest_path))
print("最短距离: {}".format(shortest_distance))
从节点 A 到节点 E 的最短路径: ['A', 'B', 'C', 'E']
最短距离: 5
- 可视化
# 创建一个网络图
G = nx.DiGraph()

# 将边添加到图中
for node, edges in graph.items():
    for neighbor, weight in edges.items():
        G.add_edge(node, neighbor, weight=weight)

# 设置图形布局
pos = nx.spring_layout(G)
# 绘制节点和边
nx.draw(
    G,
    pos,
    with_labels=True,
    node_color="lightblue",
    node_size=2000,
    font_size=16,
    font_weight="bold",
)

# 绘制边的权重
edge_labels = nx.get_edge_attributes(G, "weight")
nx.draw_networkx_edge_labels(
    G, pos, edge_labels=edge_labels, font_color="red", font_size=15
)

# 将最短路径的边标识为红色
path_edges = [
    (shortest_path[i], shortest_path[i + 1]) for i in range(len(shortest_path) - 1)
]
nx.draw_networkx_edges(G, pos, edgelist=path_edges, edge_color="red", width=2)

# 显示图形
plt.title("Graph Visualization of Dijkstra's Algorithm")
plt.show() 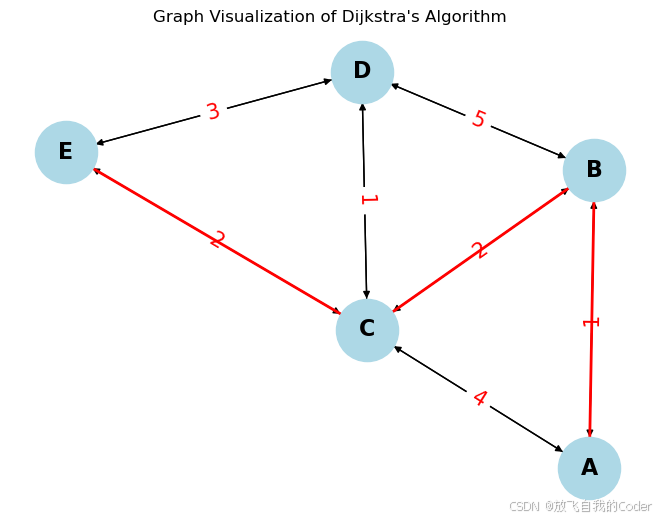


 693
693

 被折叠的 条评论
为什么被折叠?
被折叠的 条评论
为什么被折叠?
 到【灌水乐园】发言


