


不加正则项的逻辑回归
数据可视化
需要安装Python的第三方库numpy、matplotlib,安装好后:
import numpy as np
import matplotlib.pyplot as plt
给的数据是TXT文件,因此要读取TXT文件中的数据,将TXT文件中的数据读入列表,定义了函数:
def file2matrix(filename):
    fr = open(filename)
    numberOfLines = len(fr.readlines())         #get the number of lines in the file
    returnMat = np.zeros((numberOfLines,2))        #prepare matrix to return
    labeldata = np.zeros((numberOfLines,1))#prepare labels return
    fr = open(filename)
    index = 0
    for line in fr.readlines():
        line = line.strip()
        listFromLine = line.split(',')
        returnMat[index,:] = listFromLine[0:2]
        labeldata[index] = int(listFromLine[-1])
        index += 1
    return returnMat,labeldata
然后可视化数据:
data1mat,labeldata = file2matrix('ex2data1.txt')
fig = plt.figure()
ax = fig.add_subplot(111)
ax.scatter(data1mat[:,0],data1mat[:,1],c=np.array(labeldata),s=15)
plt.show()
Sigmoid函数
import numpy as np
def sigmoid(x):
    y = 1/(1+np.exp(-x))
    return y
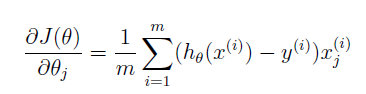
代价函数、梯度以及训练代价函数
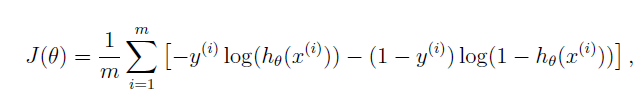
代价函数代码:
import numpy as np
import Sigmoid
def cost
最低0.47元/天 解锁文章


 673
673

 被折叠的 条评论
为什么被折叠?
被折叠的 条评论
为什么被折叠?
 到【灌水乐园】发言


