


项目场景:
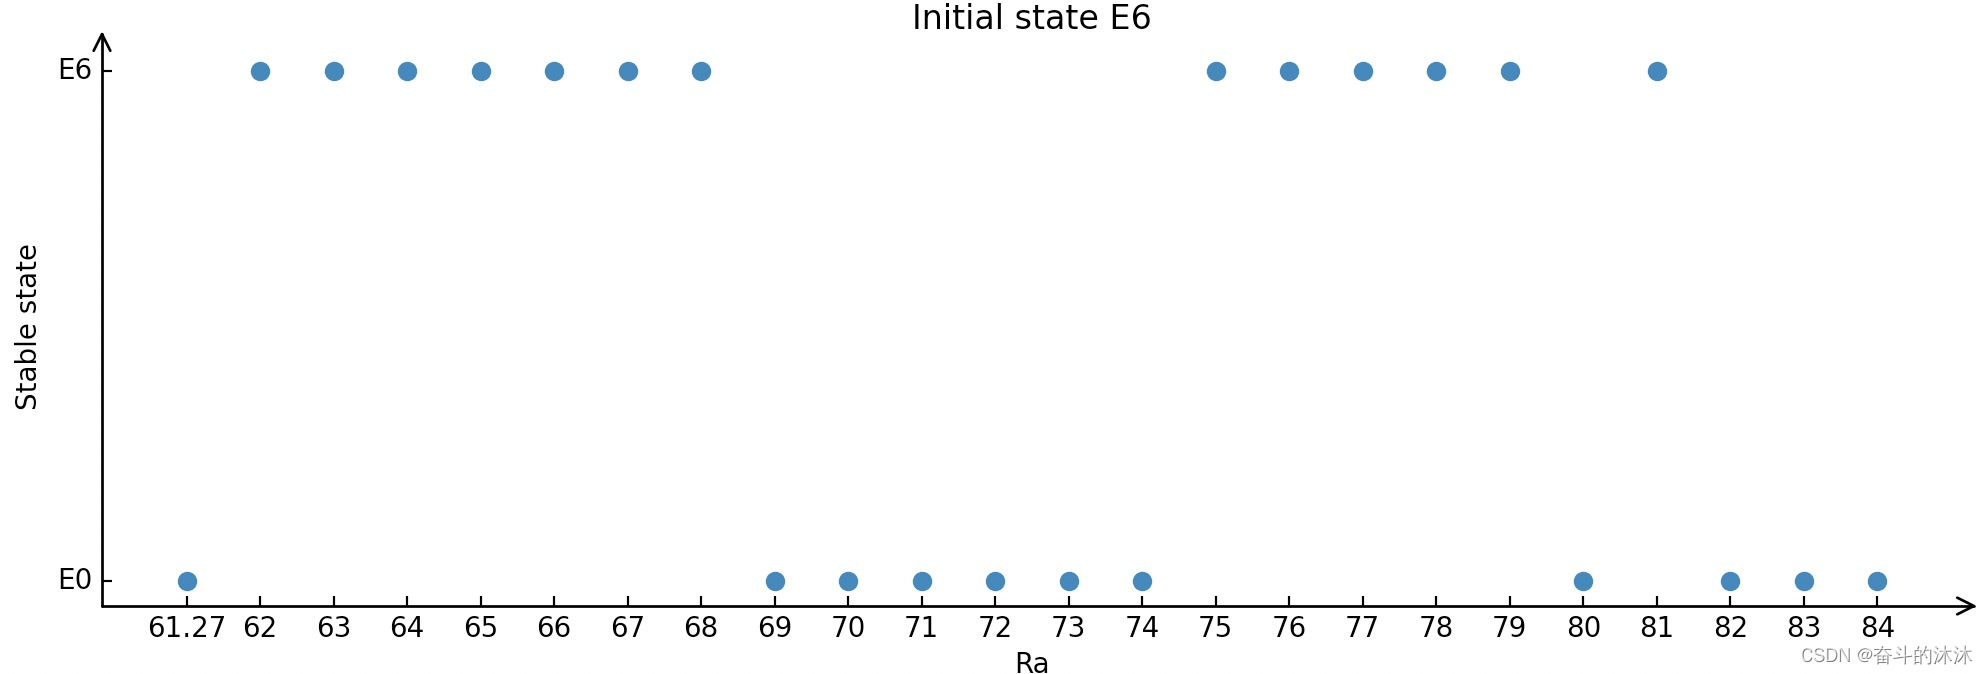
需要用python绘画带箭头的xy坐标轴,代码如下:
ax = axisartist.Subplot(fig, 212)
fig.add_axes(ax)
ax.axis["bottom"].set_axisline_style("->", size=1.5)
ax.axis["left"].set_axisline_style("->", size=1.5)
# 通过set_visible方法设置绘图区的顶部及右侧坐标轴隐藏
ax.axis["top"].set_visible(False)
ax.axis["right"].set_visible(False)

x2 = np.array(list(range(len(changElement))))
y2 = np.array(yLabelEzero)
plt.scatter(x2, y2)
a = list(set(yLabelEzero))
a.sort()
print('E0原先的演化结果为{}'.format(a))
changElementstr2 = [str(i) for i in changElement]
plt.xticks(list(range(len(yLabelEzero))), changElementstr2)
plt.ylabel('Stable state')  # 画y轴标签


 被折叠的 条评论
为什么被折叠?
被折叠的 条评论
为什么被折叠?
 到【灌水乐园】发言


