


参考链接来源:https://www.lagou.com/lgeduarticle/8153.html
使用jmxtrans+influxdb+grafana监控JMX指标
环境信息
- CentOS 6.8
- jdk 1.8.144
废话不多说,先上效果图。
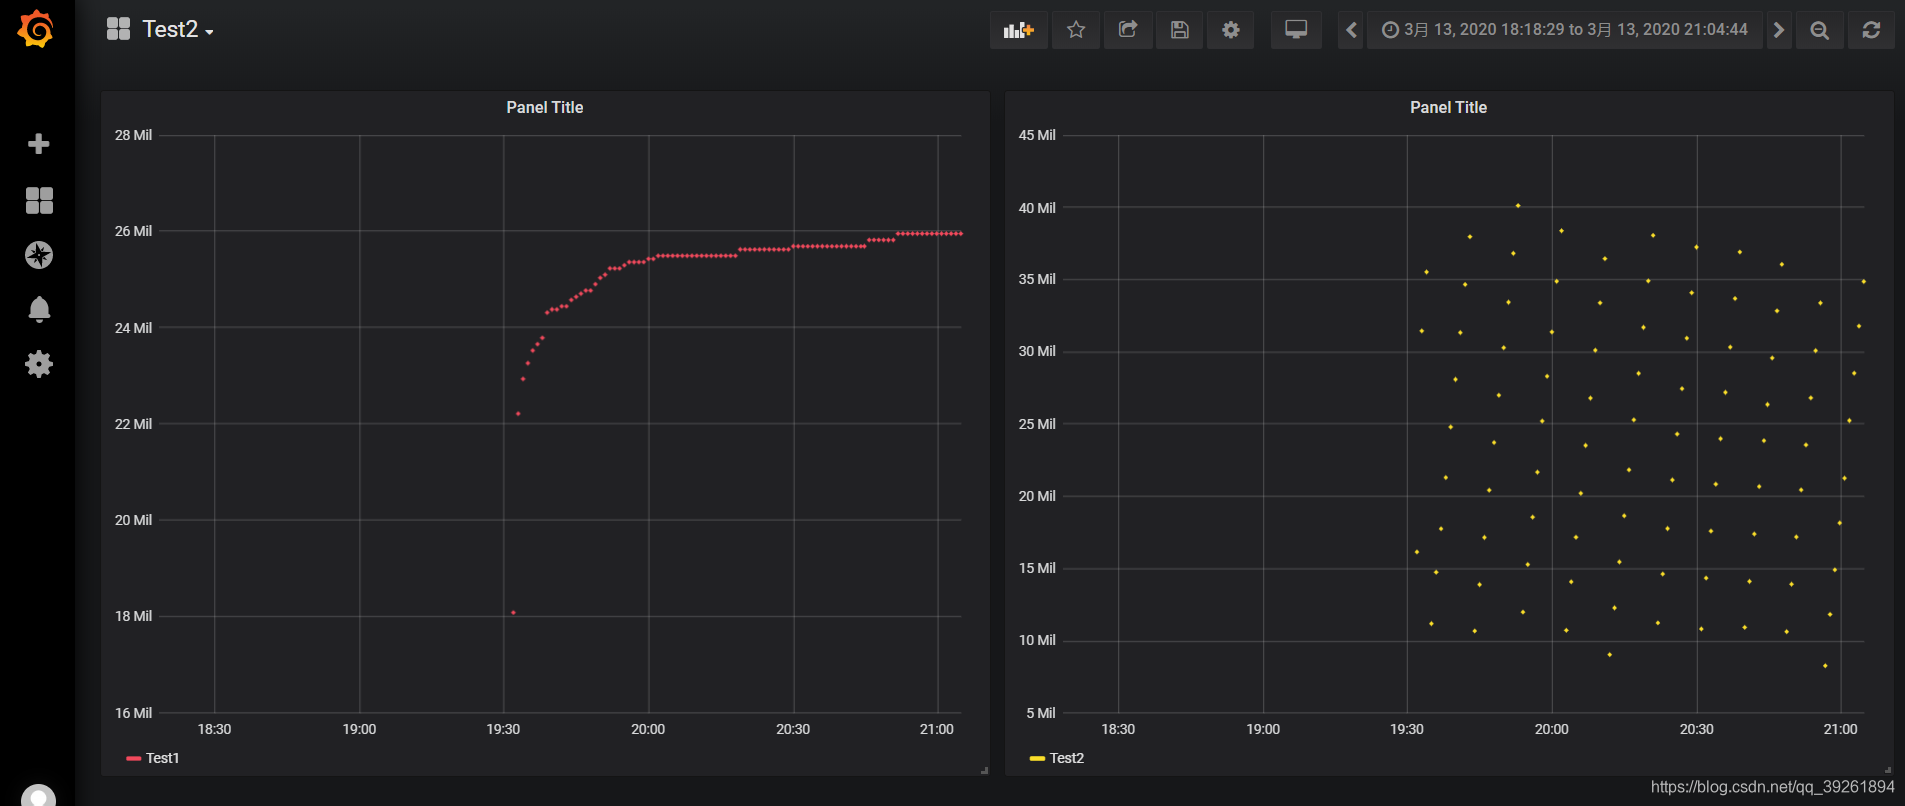
以Flume为例:
需要的环境和安装包如下:
| 安装包 | 下载链接 |
|---|---|
| jmxtrans | https://repo1.maven.org/maven2/org/jmxtrans/jmxtrans/270/jmxtrans-270.rpm |
| InfluxDB | https://dl.influxdata.com/influxdb/releases/influxdb-1.7.5.x86_64.rpm |
| grafana | https://s3-us-west-2.amazonaws.com/grafana-releases/release/grafana-6.0.2-1.x86_64.rpm |
1. 开启FlumeJMX端口
JMX(Java Management Extensions,即Java管理扩展)是一个为应用程序、设备、系统等植入管理功能的框架。JMX可以跨越一系列异构操作系统平台、系统体系结构和网络传输协议,灵活的开发无缝集成的系统、网络和服务管理应用。Flume做为一款Java应用,已经定义了丰富的性能指标,(可以参考Flume监控指标),通过JMX可以轻松对其进行监控。
参考官网的配置链接: http://flume.apache.org/releases/content/1.9.0/FlumeUserGuide.html#flume-interceptors
- 在Flume的conf目录下的flume-env.sh
export JAVA_OPTS="-Dcom.sun.management.jmxremote -Dcom.sun.management.jmxremote.port=5445 -Dcom.sun.management.jmxremote.authenticate=false -Dcom.sun.management.jmxremote.ssl=false"
- 重启Flume
- 重启后查看Flume以及JMX端口状态
ps -ef | grep flume
atguigu   7024  3138  0 19:31 pts/0    00:00:16 /opt/module/jdk1.8.0_144/bin/java -Dcom.sun.management.jmxremote -Dcom.sun.management.jmxremote.port=5445 -Dcom.sun.management.jmxremote.authenticate=false -Dcom.sun.management.jmxremote.ssl=false -Dflume.monitoring.type=http -Dflume.monitoring.port=34545 -Dflume.root.logger=INFO,console -cp /opt/module/apache-flume-1.7.0/conf:/opt/module/apache-flume-1.7.0/lib/*:/opt/module/hadoop-2.7.2/etc/hadoop:/opt/module/hadoop-2.7.2/share/hadoop/common/lib/*:/opt/module/hadoop-2.7.2/share/hadoop/common/*:/opt/module/hadoop-2.7.2/share/hadoop/hdfs:/opt/module/hadoop-2.7.2/share/hadoop/hdfs/lib/*:/opt/module/hadoop-2.7.2/share/hadoop/hdfs/*:/opt/module/hadoop-2.7.2/share/hadoop/yarn/lib/*:/opt/module/hadoop-2.7.2/share/hadoop/yarn/*:/opt/module/hadoop-2.7.2/share/hadoop/mapreduce/lib/*:/opt/module/hadoop-2.7.2/share/hadoop/mapreduce/*:/opt/module/hadoop-2.7.2/contrib/capacity-scheduler/*.jar:/opt/module/apache-hive-1.2.1/lib/* -Djava.library.path=:/opt/module/hadoop-2.7.2/lib/native org.apache.flume.node.Application -n a1 -f flumeagents/taildirSource-loggerSink.conf

netstat -anop | grep 5445
tcp        0      0 :::5445                     :::*                        LISTEN      7024/java           off (0.00/0/0)
2. 安装InfluxDB
InfluxDB是一个时间序列数据库,用于处理海量写入与负载查询。InfluxDB旨在用作涉及大量时间戳数据的任何用例(包括DevOps监控,应用程序指标,物联网传感器数据和实时分析)的后端存储。
- 安装rpm包
rpm -ivh influxdb-1.7.5.x86_64.rpm
Preparing...                          ################################# [100%]
Updating / installing...
   1:influxdb-1.7.5-1                 ################################# [100%]
Created symlink from /etc/systemd/system/influxd.service to /usr/lib/systemd/system/influxdb.service.
Created symlink from /etc/systemd/system/multi-user.target.wants/influxdb.service to /usr/lib/systemd/system/influxdb.service.
如果发送安装错误如:
Failed dependencies: java >= 1.7 is needed by jmxtrans-270-1.noarch
错误修复引用:https://github.com/jmxtrans/jmxtrans/issues/684
则使用命令 rpm -i jmxtrans-270.rpm --nodeps --force安装
- 启动InfluxDB
service influxdb start
Redirecting to /bin/systemctl start influxdb.service
- 查看InfluxDB状态
ps -ef | grep influxdb
influxdb   8475      1  2 03:01 ?        00:00:00 /usr/bin/influxd -config /etc/influxdb/influxdb.conf
root       8486   7007  0 03:02 pts/0    00:00:00 grep --color=auto influxdb

service influxdb status
Redirecting to /bin/systemctl status influxdb.service
● influxdb.service - InfluxDB is an open-source, distributed, time series database
   Loaded: loaded (/usr/lib/systemd/system/influxdb.service; enabled; vendor preset: disabled)
   Active: active (running) since Wed 2019-04-10 03:01:48 EDT; 22s ago
     Docs: https://docs.influxdata.com/influxdb/
 Main PID: 8475 (influxd)
   CGroup: /system.slice/influxdb.service
           └─8475 /usr/bin/influxd -config /etc/influxdb/influxdb.conf

Apr 10 03:01:48 node1 influxd[8475]: ts=2019-04-10T07:01:48.375804Z lvl=info msg="Starting precreation service" log_id=0EiWgWRl000 service=shard-precreation check_interval=10m advance_period=30m
Apr 10 03:01:48 node1 influxd[8475]: ts=2019-04-10T07:01:48.375810Z lvl=info msg="Starting snapshot service" log_id=0EiWgWRl000 service=snapshot
Apr 10 03:01:48 node1 influxd[8475]: ts=2019-04-10T07:01:48.375816Z lvl=info msg="Starting continuous query service" log_id=0EiWgWRl000 service=continuous_querier
Apr 10 03:01:48 node1 influxd[8475]: ts=2019-04-10T07:01:48.375826Z lvl=info msg="Starting HTTP service" log_id=0EiWgWRl000 service=httpd authentication=false
Apr 10 03:01:48 node1 influxd[8475]: ts=2019-04-10T07:01:48.375830Z lvl=info msg="opened HTTP access log" log_id=0EiWgWRl000 service=httpd path=stderr
Apr 10 03:01:48 node1 influxd[8475]: ts=2019-04-10T07:01:48.375936Z lvl=info msg="Listening on HTTP" log_id=0EiWgWRl000 service=httpd addr=[::]:8086 https=false
Apr 10 03:01:48 node1 influxd[8475]: ts=2019-04-10T07:01:48.375949Z lvl=info msg="Starting retention policy enforcement service" log_id=0EiWgWRl000 service=retention check_interval=30m
Apr 10 03:01:48 node1 influxd[8475]: ts=2019-04-10T07:01:48.376138Z lvl=info msg="Listening for signals" log_id=0EiWgWRl000
Apr 10 03:01:48 node1 influxd[8475]: ts=2019-04-10T07:01:48.376389Z lvl=info msg="Storing statistics" log_id=0EiWgWRl000 service=monitor db_instance=_internal db_rp=monitor interval=10s
Apr 10 03:01:48 node1 influxd[8475]: ts=2019-04-10T07:01:48.376534Z lvl=info msg="Sending usage statistics to usage.influxdata.com" log_id=0EiWgWRl000
- 使用InfluxDB客户端
influx
Connected to http://localhost:8086 version 1.7.5
InfluxDB shell version: 1.7.5
Enter an InfluxQL query
>
- 创建用户和数据库
CREATE USER "admin" WITH PASSWORD 'admin' WITH ALL PRIVILEGES
create database "jmxDB"
- 创建完成InfluxDB的用户和数据库暂时就够用了,其它简单操作如下,后面会用到
#创建数据库
create database "db_name"
#显示所有的数据库
show databases
#删除数据库
drop database "db_name"
#使用数据库
use db_name
#显示该数据库中所有的表
show measurements
#创建表,直接在插入数据的时候指定表名
insert test,host=127.0.0.1,monitor_name=test count=1
#删除表
drop measurement "measurement_name"
#退出
quit
3. 安装jmxtrans
jmxtrans的作用是自动去jvm中获取所有jmx格式数据,并按照某种格式(json文件配置格式)输出到其他应用程序(本例中的influxDB)。
- 安装rpm包
rpm -ivh jmxtrans-270.rpm
Preparing... ################################# [100%]
Updating / installing...
1:jmxtrans-270-1 ################################# [100%]
Jmxtrans相关路径
jmxtrans安装目录:/usr/share/jmxtrans
json文件默认目录:/var/lib/jmxtrans/
日志路径:/var/log/jmxtrans/jmxtrans.log
配置json,jmxtrans的github上有一段示例配置
https://github.com/jmxtrans/jmxtrans/wiki/Installation
- GitHub示例
{
  "servers" : [ {
    "port" : "${myserverport}",
    "host" : "${myserverhost}",
    "queries" : [ {
      "obj" : "java.lang:type=Memory",
      "attr" : [ "HeapMemoryUsage", "NonHeapMemoryUsage" ],
      "outputWriters" : [ {
        "@class" : "com.googlecode.jmxtrans.model.output.GraphiteWriter",
          "port" : "${mygraphiteport}",
          "host" : "${mygraphitehost}"
      } ]
    } ]
  } ]
}

# host:监控服务器
# port:jmx端口
# obj:对应jmx的ObjectName,就是我们要监控的指标
# attr:对应ObjectName的属性,可以理解为我们要监控的指标的值
# resultAlias:对应metric 的名称,在InfluxDB里面就是MEASUREMENTS名
# tags:对应InfluxDB的tag功能,对与存储在同一个MEASUREMENTS里面的不同监控指标可以做区分,我们在用Grafana绘图的时候会用到,建议对每个监控指标都打上tags
- 例如Flume:
{
  "servers" : [ {
    "port" : "5445",
    "host" : "hadoop101",
    "queries" : [ {
      "obj" : "java.lang:type=Memory",
      "attr" : [ "HeapMemoryUsage", "NonHeapMemoryUsage" ],
      "resultAlias":"jvmMemory",
      "outputWriters" : [ {
        "@class" : "com.googlecode.jmxtrans.model.output.InfluxDbWriterFactory",
        "url" : "http://127.0.0.1:8086/",
        "username" : "admin",
        "password" : "admin",
        "database" : "jmxDB",
        "tags"     : {"application" : "flume"}
      } ]
    } ]
  } ]
}
- 启动jmxtrans
service jmxtrans start
Starting JmxTrans...
3.查看日志没有报错即为成功
tail /var/log/jmxtrans/jmxtrans.log
INFO   | jvm 1    | 2020/03/13 20:44:04 |   Currently in standby mode.
INFO   | jvm 1    | 2020/03/13 20:44:04 |   Number of jobs executed: 0
INFO   | jvm 1    | 2020/03/13 20:44:04 |   Using thread pool 'org.quartz.simpl.SimpleThreadPool' - with 10 threads.
INFO   | jvm 1    | 2020/03/13 20:44:04 |   Using job-store 'org.quartz.simpl.RAMJobStore' - which does not support persistence. and is not clustered.
INFO   | jvm 1    | 2020/03/13 20:44:04 |
INFO   | jvm 1    | 2020/03/13 20:44:04 | 2020-03-13 20:44:04 [WrapperSimpleAppMain] INFO  org.quartz.impl.StdSchedulerFactory - Quartz scheduler 'ServerScheduler' initialized from an externally opened InputStream.
INFO   | jvm 1    | 2020/03/13 20:44:04 | 2020-03-13 20:44:04 [WrapperSimpleAppMain] INFO  org.quartz.impl.StdSchedulerFactory - Quartz scheduler version: 1.8.6
INFO   | jvm 1    | 2020/03/13 20:44:04 | 2020-03-13 20:44:04 [WrapperSimpleAppMain] INFO  org.quartz.core.QuartzScheduler - JobFactory set to: com.googlecode.jmxtrans.guice.GuiceJobFactory@665bcfdb
INFO   | jvm 1    | 2020/03/13 20:44:04 | 2020-03-13 20:44:04 [WrapperSimpleAppMain] INFO  c.googlecode.jmxtrans.JmxTransformer - Starting Jmxtrans on : /var/lib/jmxtrans
INFO   | jvm 1    | 2020/03/13 20:44:04 | 2020-03-13 20:44:04 [WrapperSimpleAppMain] INFO  org.quartz.core.QuartzScheduler - Scheduler ServerScheduler_$_hadoop1011584103444658 s
4. 安装Grafana
Grafana是一个跨平台的开源的度量分析和可视化工具,可以通过将采集的数据查询然后可视化的展示,并及时通知。
- 安装rpm包
rpm -ivh grafana-6.0.2-1.x86_64.rpm
warning: grafana-6.0.2-1.x86_64.rpm: Header V4 RSA/SHA1 Signature, key ID 24098cb6: NOKEY
Preparing...                          ################################# [100%]
Updating / installing...
   1:grafana-6.0.2-1                  ################################# [100%]
### NOT starting on installation, please execute the following statements to configure grafana to start automatically using systemd
 sudo /bin/systemctl daemon-reload
 sudo /bin/systemctl enable grafana-server.service
### You can start grafana-server by executing
 sudo /bin/systemctl start grafana-server.service
POSTTRANS: Running script
- 启动Grafana
service grafana-server start
Starting grafana-server (via systemctl): [ OK ]
- 打开浏览器
http://安装Grafana的主机IP:3000 - 输入默认的用户名和密码
admin/admin

- 设置新密码
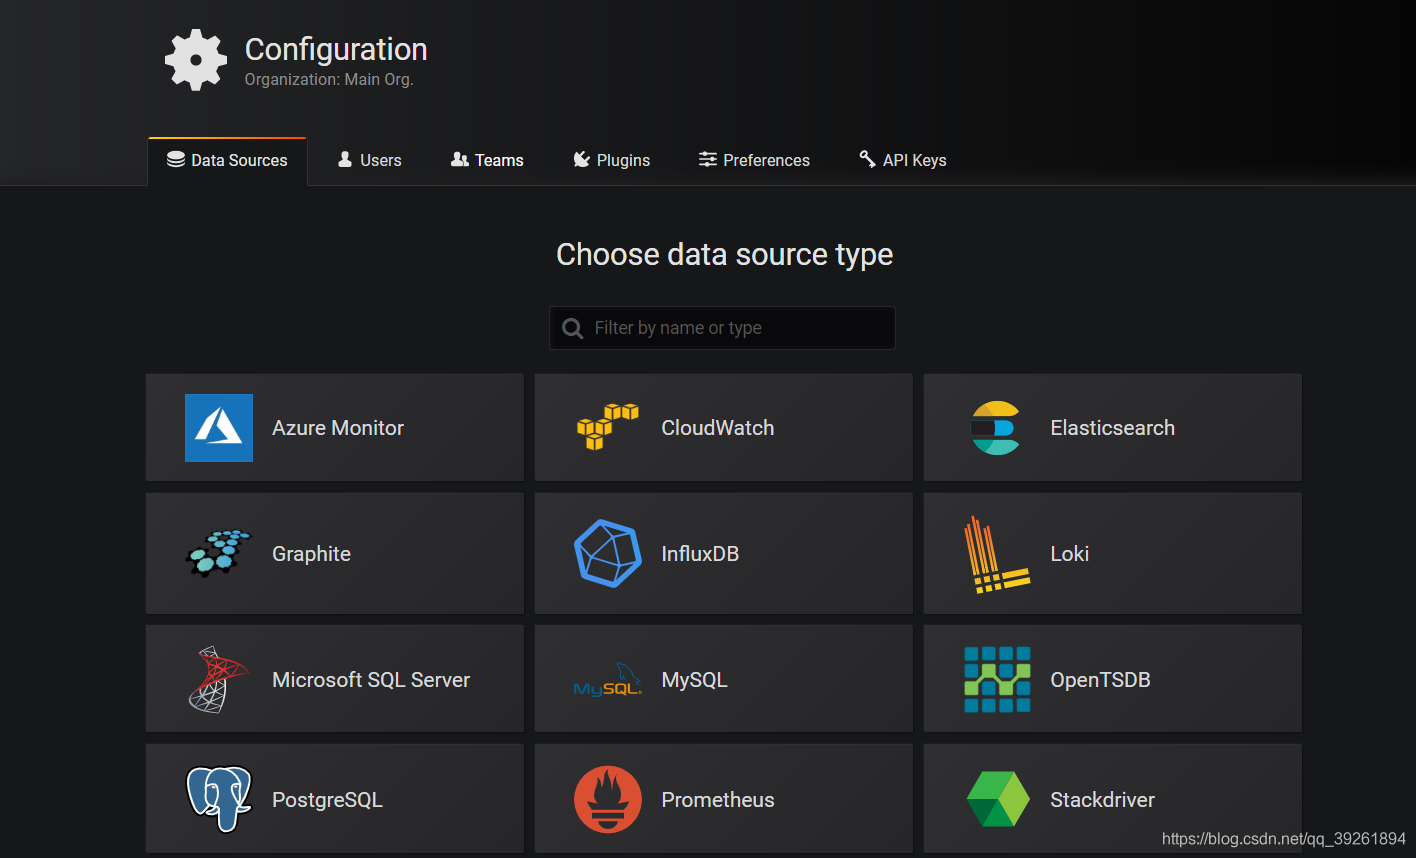
- 点击Add data source,选择InfluxDB
- 配置如下信息
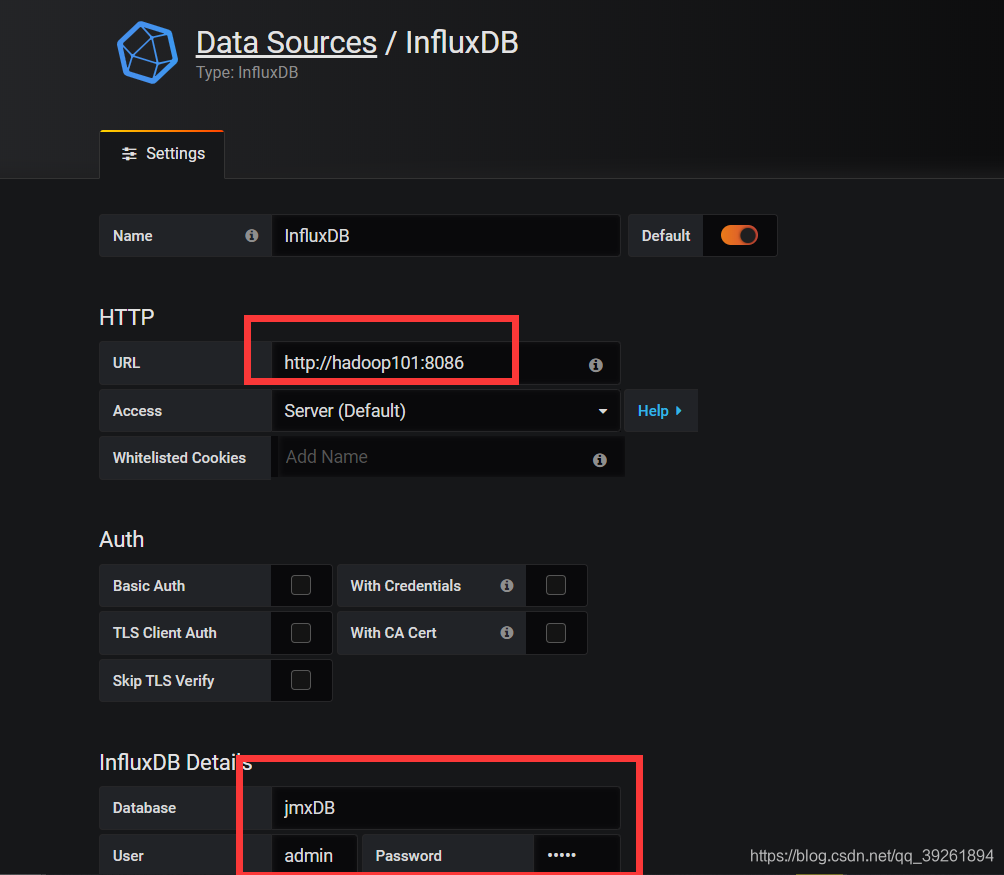
8. 输入连接信息后点击Save & Test
9. 通过后点击Back返回
10.左侧 + 可以创建或引入仪表盘
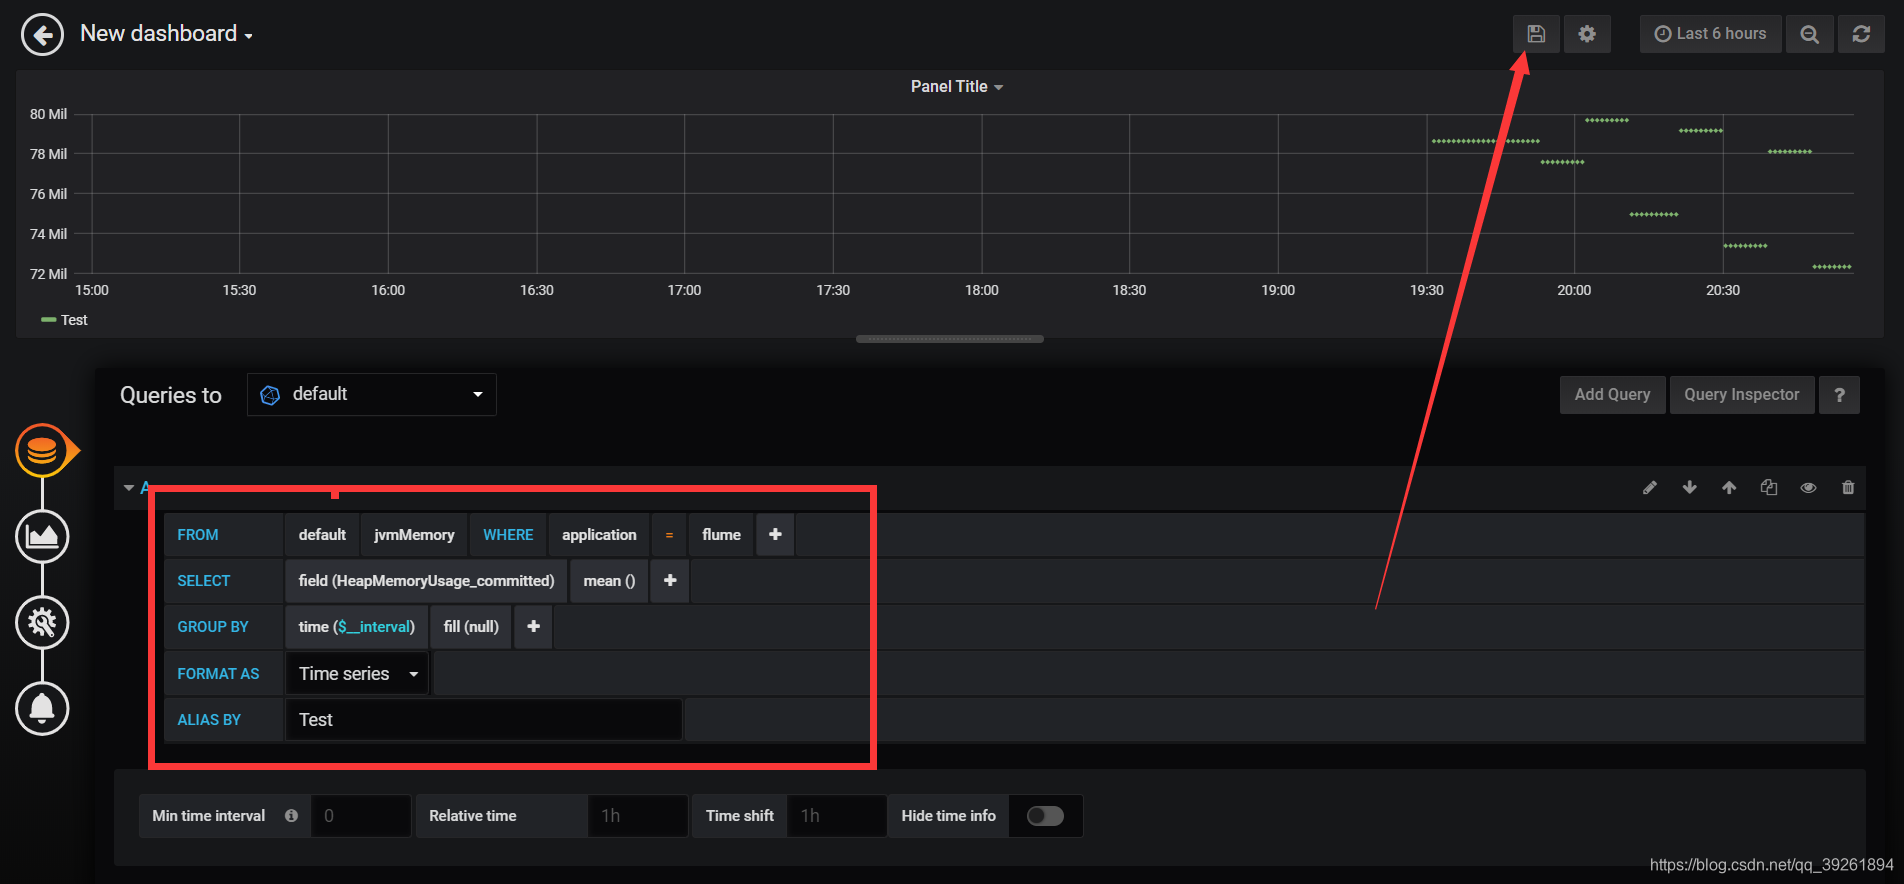
配置完成后点击右上方保存
至此,Flume的JMX指标监控就完成了。 类似的,在ZK,Kafka等使用JVM的框架也可使用。


 192
192

 被折叠的 条评论
为什么被折叠?
被折叠的 条评论
为什么被折叠?
 到【灌水乐园】发言


