


 本文详细介绍如何在两台CentOS 7.6系统上搭建并配置ELK Stack(Elasticsearch、Logstash、Kibana),实现日志收集、处理和可视化分析。包括环境准备、软件安装、配置修改及插件安装等关键步骤。
准备环境
2台机器 配置都是内存2G 2个1核的CPU
192.168.50.173
192.168.50.174
[root@174 ~]# cat /etc/redhat-release
CentOS Linux release 7.6.1810 (Core)
[root@174 ~]# getenforce 查看selinux是否关了
Disabled
[root@174 ~]# systemctl status firewalld.service 查看防火墙是否关了
● firewalld.service - firewalld - dynamic firewall daemon
Loaded: loaded (/usr/lib/systemd/system/firewalld.service; disabled; vendor preset: enabled)
Active: inactive (dead)
[root@174 ~]# yum -y install java 安装JAVA
[root@174 ~]# java -version
openjdk version “1.8.0_222”
需要用到安装包在这里
https://download.youkuaiyun.com/download/qq_39043100/11588666
安装elasticsearch-2.3.0.rpm 2台机器都要做这个步骤
[root@174 ~]# ls
logstash-2.3.0-1.noarch.rpm elasticsearch-2.3.0.rpm elasticsearch-2.3.0.rpm
[root@174 ~]# rpm -ivh elasticsearch-2.3.0.rpm 安装elasticsearch
[root@174 ~]# mkdir -p /data/es-data/
[root@174 ~]#chown -R elasticsearch:elasticsearch /data/es-data/
[root@174 ~]# vim /etc/elasticsearch/elasticsearch.yml 修改配置文件
cluster.name: lrw //集群名称
node.name: node-4 //节点名称 //另外一台改个名字
path.data: /data/es-data //数据存放目录
path.logs: /var/log/elasticsearch/ //日志存放目录
network.host: 0.0.0.0 //监听网络
http.port: 9200 //端口
discovery.zen.ping.unicast.hosts: [“192.168.50.173”, “192.168.50.174”] //集群的节点IP
[root@174 ~]# systemctl restart elasticsearch.service 启动elasticsearch
[root@174 ~]# curl 192.168.50.174:9200 测试访问
{
“name” : “node-4”,
“cluster_name” : “lrw”,
“version” : {
“number” : “2.3.0”,
“build_hash” : “8371be8d5fe5df7fb9c0516c474d77b9feddd888”,
“build_timestamp” : “2016-03-29T07:54:48Z”,
“build_snapshot” : false,
“lucene_version” : “5.5.0”
},
“tagline” : “You Know, for Search”
}
安装插件
[root@174 ~]#/usr/share/elasticsearch/bin/plugin install mobz/elasticsearch-head
[root@174 ~]# /usr/share/elasticsearch/bin/plugin install lmenezes/elasticsearch-kopf
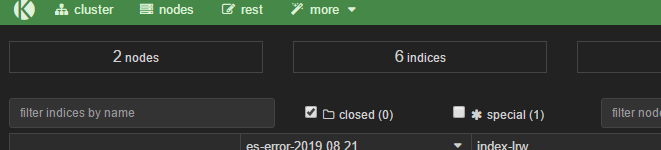
用浏览器访问http://192.168.50.174:9200/_plugin/head

出现这个就成功安装插件了
再访问http://192.168.50.174:9200/_plugin/kopf/#!/cluster
安装 在174的机器上logstash
[root@174 ~]# rpm -ivh logstash-2.3.0-1.noarch.rpm
#内容写进elasticsearch中
[root@174 ~]# /opt/logstash/bin/logstash -e ‘input { stdin{} } output { elasticsearch{hosts=>[“192.168.50.174”]} }’
Settings: Default pipeline workers: 2
Pipeline main started
i love eat #自己输入
123 #自己输入
hehehehe #自己输入
^CSIGINT received. Shutting down the agent. {:level=>:warn} #强制退出ctrl+C
stopping pipeline {:id=>“main”}
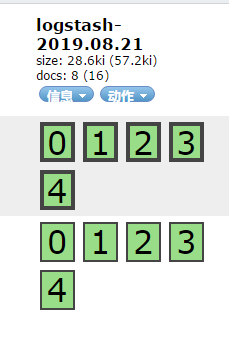
在页面http://192.168.50.174:9200/_plugin/head/会看到
收集elk错误日志和系统日志配置文件编写
[root@174 ~]# vim /etc/logstash/conf.d/elk_log.conf
https://blog.youkuaiyun.com/qq_39043100/article/details/99983565
文件内容在这里面
[root@174 ~]# /opt/logstash/bin/logstash -f /etc/logstash/conf.d/elk_log.conf & 放在后台运行
在173的机器上安装Kibana
[root@173 ~]# tar -xf kibana-4.3.0-linux-x64.tar.gz
[root@173 ~]# vim /root/kibana-4.3.0-linux-x64/config/kibana.yml
server.port: 5601
server.host: “0.0.0.0”
elasticsearch.url: “http://192.168.50.174:9200” #指定elasticsearch的集群随便一个IP
kibana.index: “.kibana”
[root@173 ~]# /root/kibana-4.3.0-linux-x64/bin/kibana & 后台启动
访问http://192.168.50.173:5601
这里随便写一个索引名字,es-error-*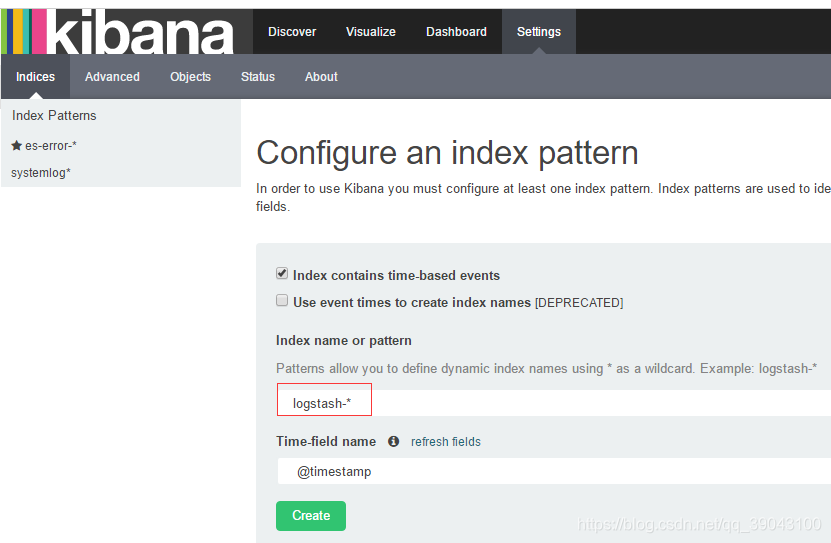
大概就这样把


 2085
2085

 被折叠的 条评论
为什么被折叠?
被折叠的 条评论
为什么被折叠?
 到【灌水乐园】发言


