


 本文介绍了基于Redis、Kibana、Elasticsearch和Nginx的信息采集与展示实验。阐述了实验环境搭建,包括在server3安装Kibana。详细说明了Redis做解耦的流程,以及在Kibana中添加联系人、总访问量、top10排行榜等操作,最终实现实时数据采集和展示。
实验环境
server1    172.25.11.1    elasticsearch、nginx  、logstash
server2    172.25.11.2    redis、logstash
server3    172.25.11.3    kibana
server3上安装kibana
yum install -y kibana-4.5.1-1.x86_64.rpm
vim /opt/kibana/config/kibana.yml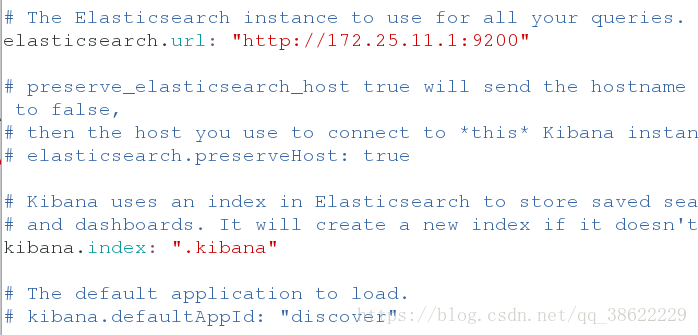
/etc/init.d/kibana start
netstat -antupl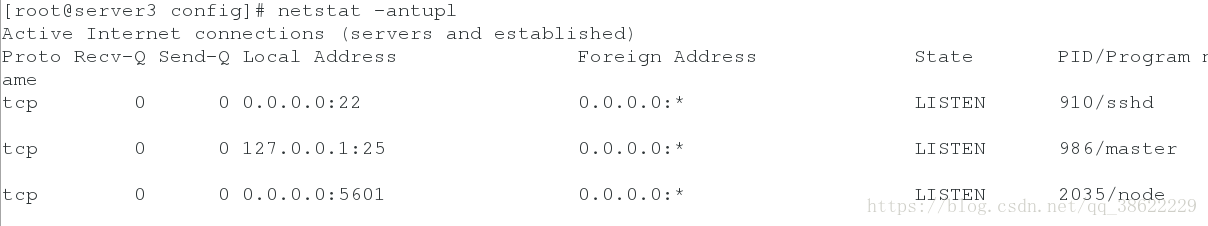
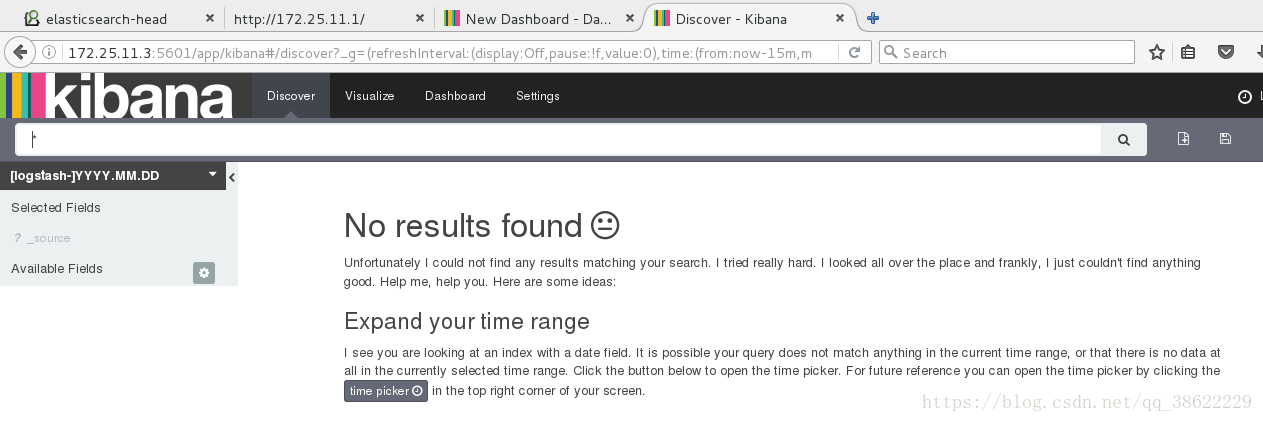
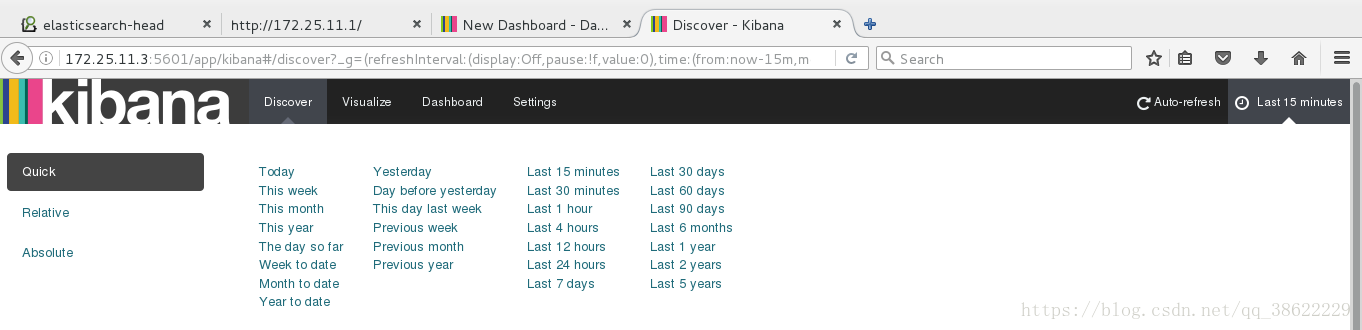
浏览器访问:172.25.11.3:5601
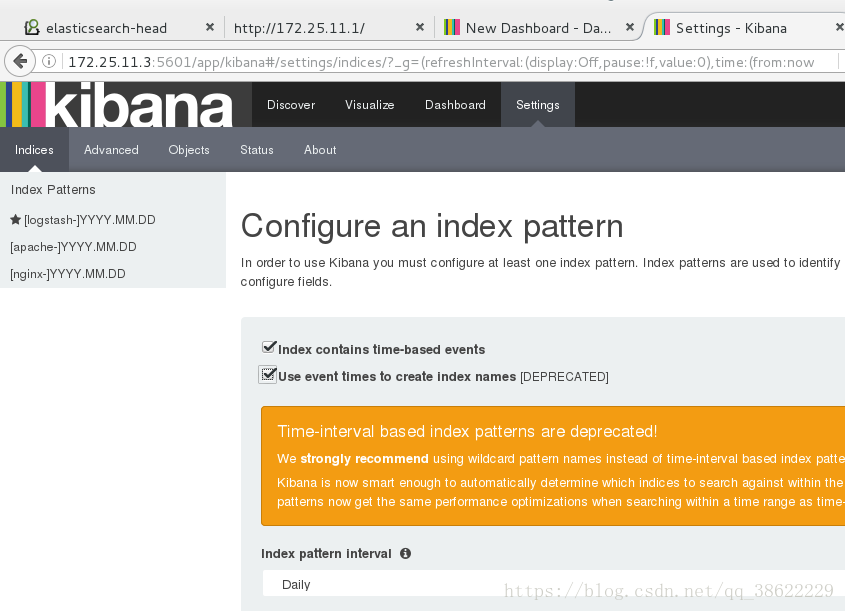
点击settings
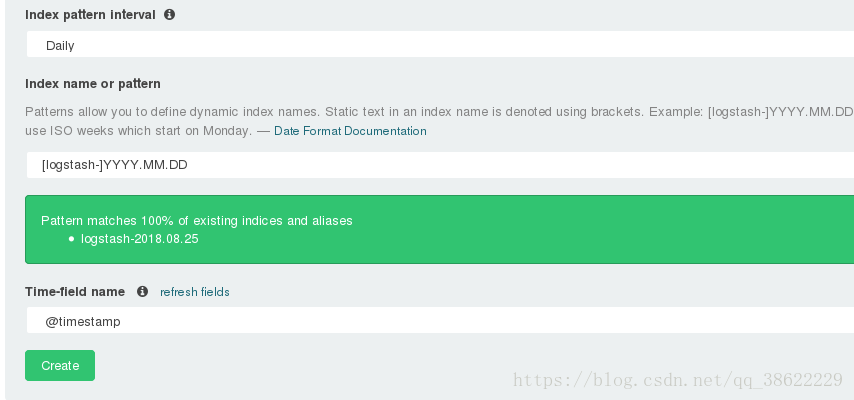
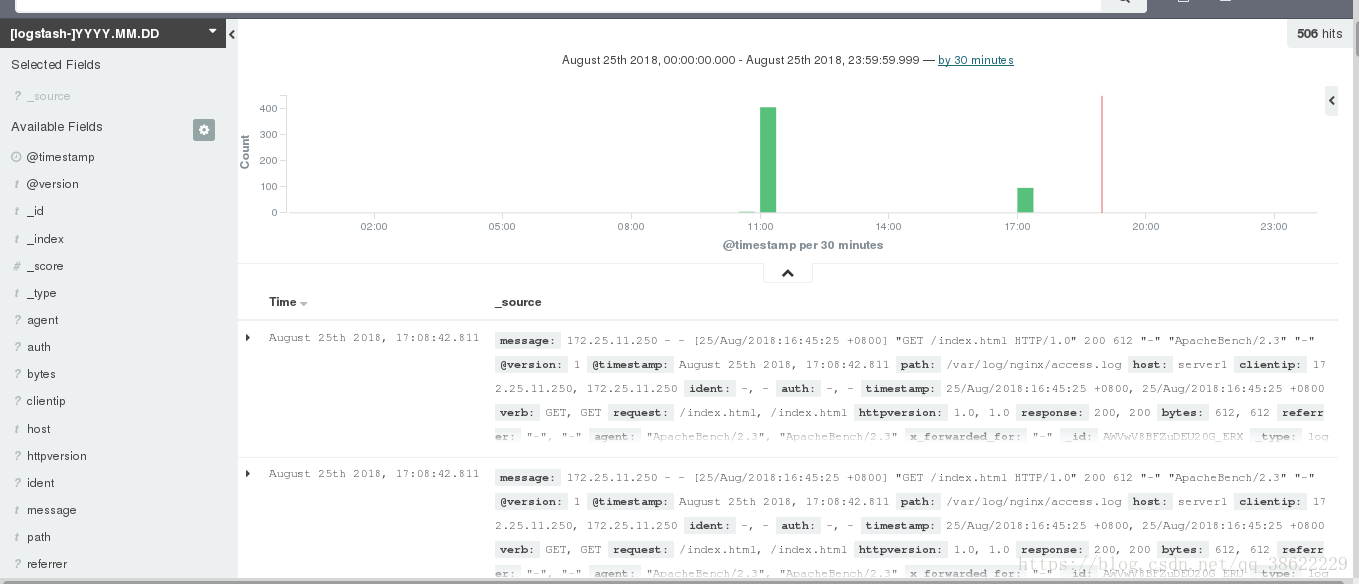
点击Discover–>点击右上角钟表–>选择today
redis做解藕的流程
logstash input{nginx} out{redis} -> input{redis} output {elasticsearch}–>elasticsearch–>kibana
server2:
安装redis
tar zxf redis-3.0.6.tar.gz
cd redis-3.0.6
yum install -y gcc
make
make install
cd utils/
开启服务:(一路回车)
[root@server2 utils]# ./install_server.sh
Welcome to the redis service installer
This script will help you easily set up a running redis server

Please select the redis port for this instance: [6379]
Selecting default: 6379
Please select the redis config file name [/etc/redis/6379.conf]
Selected default - /etc/redis/6379.conf
Please select the redis log file name [/var/log/redis_6379.log]
Selected default - /var/log/redis_6379.log
Please select the data directory for this instance [/var/lib/redis/6379]
Selected default - /var/lib/redis/6379
Please select the redis executable path [/usr/local/bin/redis-server]
Selected config:
Port           : 6379
Config file    : /etc/redis/6379.conf
Log file       : /var/log/redis_6379.log
Data dir       : /var/lib/redis/6379
Executable     : /usr/local/bin/redis-server
Cli Executable : /usr/local/bin/redis-cli
Is this ok? Then press ENTER to go on or Ctrl-C to abort.
Copied /tmp/6379.conf => /etc/init.d/redis_6379
Installing service...
Successfully added to chkconfig!
Successfully added to runlevels 345!
Starting Redis server...
Installation successful!
查看端口
netstat -antupl|grep 6379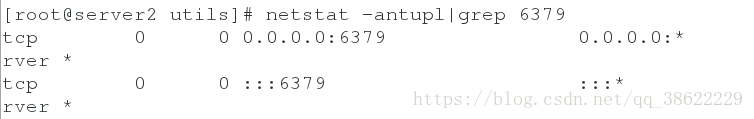
server1:
rpm -ivh logstash-2.3.3-1.noarch.rpm
vim /etc/logstash/conf.d/nginx.conf
input {
        file {
                path => "/var/log/nginx/access.log"
                start_position => "beginning"
        }
}

filter {
        grok {
                match => { "message" => "%{COMBINEDAPACHELOG} %{QS:x_forwarded_for}" }
        }
}
output {
        redis {
                host => ["172.25.11.2"]
                port => 6379
                data_type => "list"
                key => "logstash:redis"
        }
}/etc/init.d/nginx start
chmod +x /var/log/nginx/access.log # 文件在打入后台执行时是logstash身份执行,所以必须有读的权限
移出所有/etc/logstash/conf.d/下面除nginx.conf之外的所有.conf文件,否则会影响运行结果server2
rpm -ivh logstash-2.3.3-1.noarch.rpm
vim /etc/logstash/conf.d/es.conf
input {
        redis {
                host => "172.25.11.2"
                port => 6379
                data_type => "list"
                key => "logstash:redis"
        }
}
output {
        elasticsearch {
                hosts => ["172.25.11.1"]
                index => "nginx-%{+YYYY.MM.dd}"
        }
}
浏览器中进入kibana网页
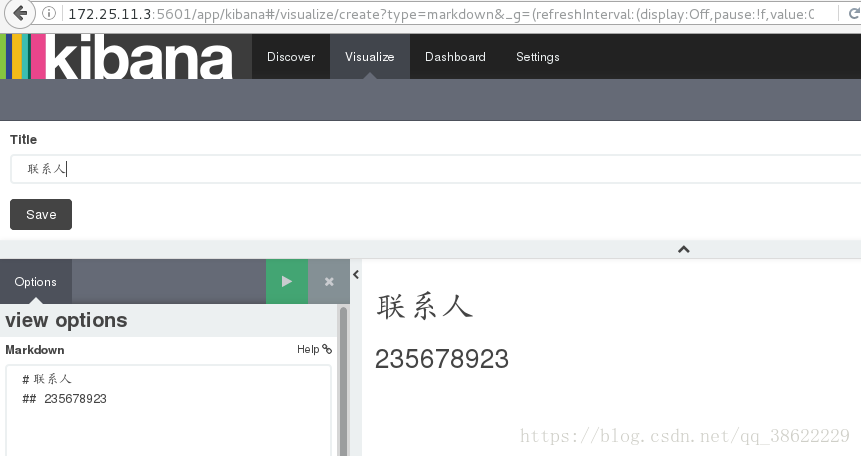
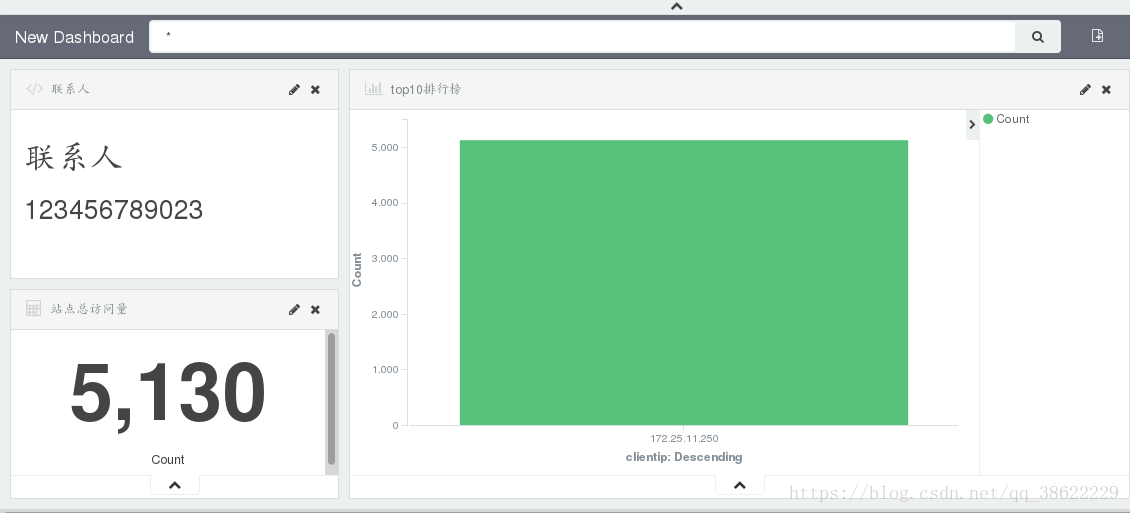
点击Visualize–>Markdown widget–>添加联系人
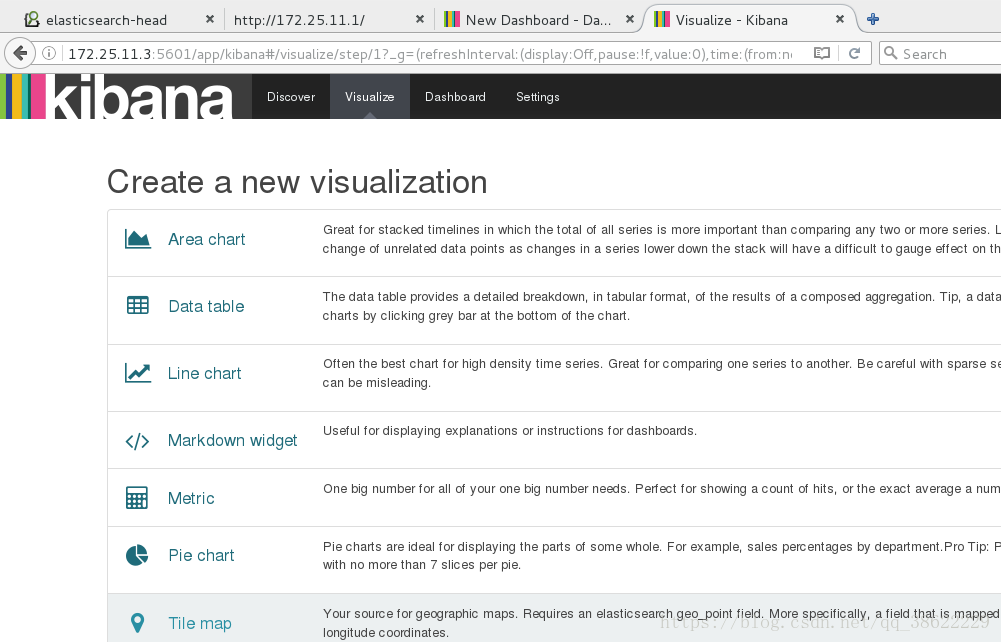
添加联系人,运行,保存
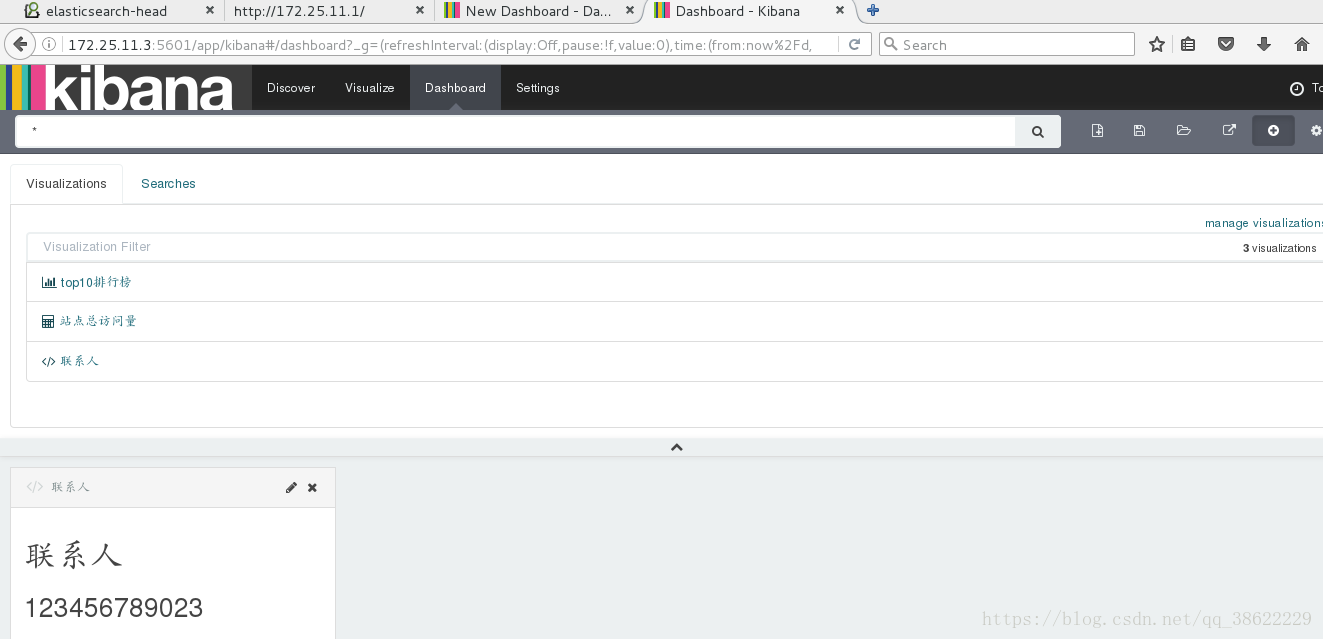
将联系人添加如Dashboard
点击右上角的+号–>选择所要添加的东西
添加总访问量
点击Visualize–>Metric
创建一个新的,选择nginx服务

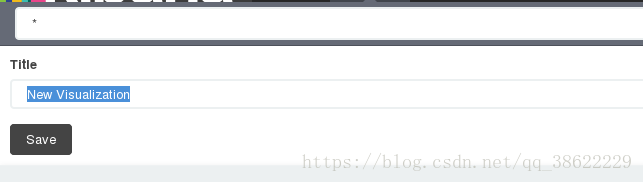
点击保存,写入名称保存
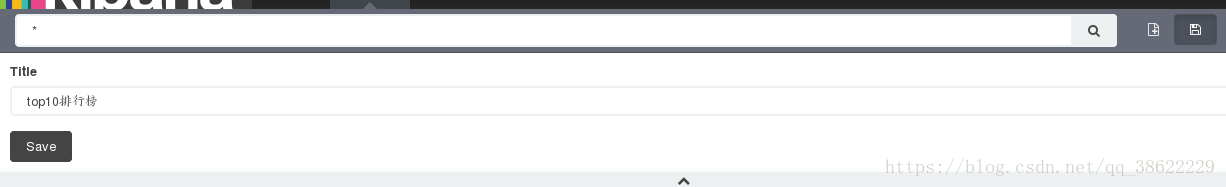
添加top10排行榜
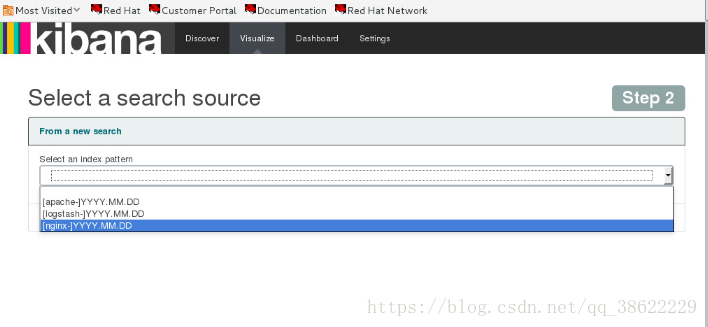
点击Visualize–>添加条形图(Vertical bar chart)
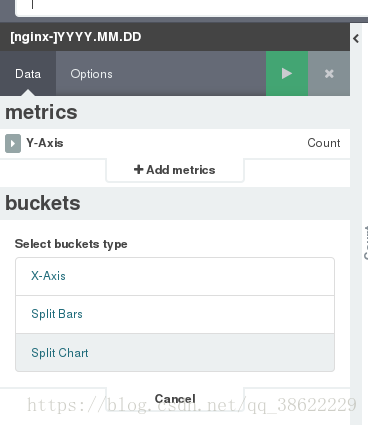
选择服务nginx
点击添加x轴 X-Axis
选择x轴参数
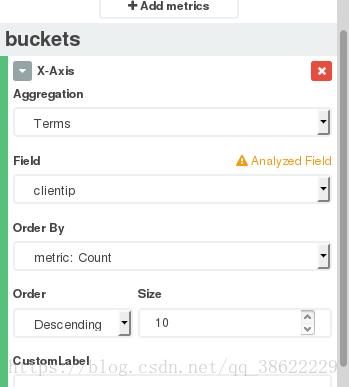
点击运行横轴策划线ip
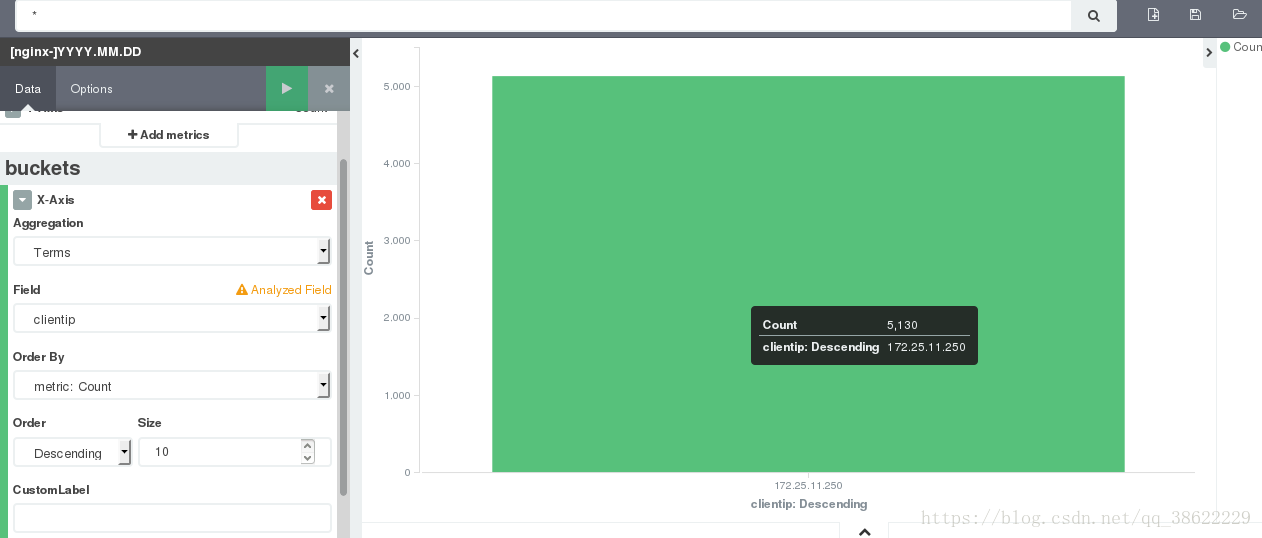
点击保存
点击Dashboard将刚才创建的加入(按照上面同样的操作)
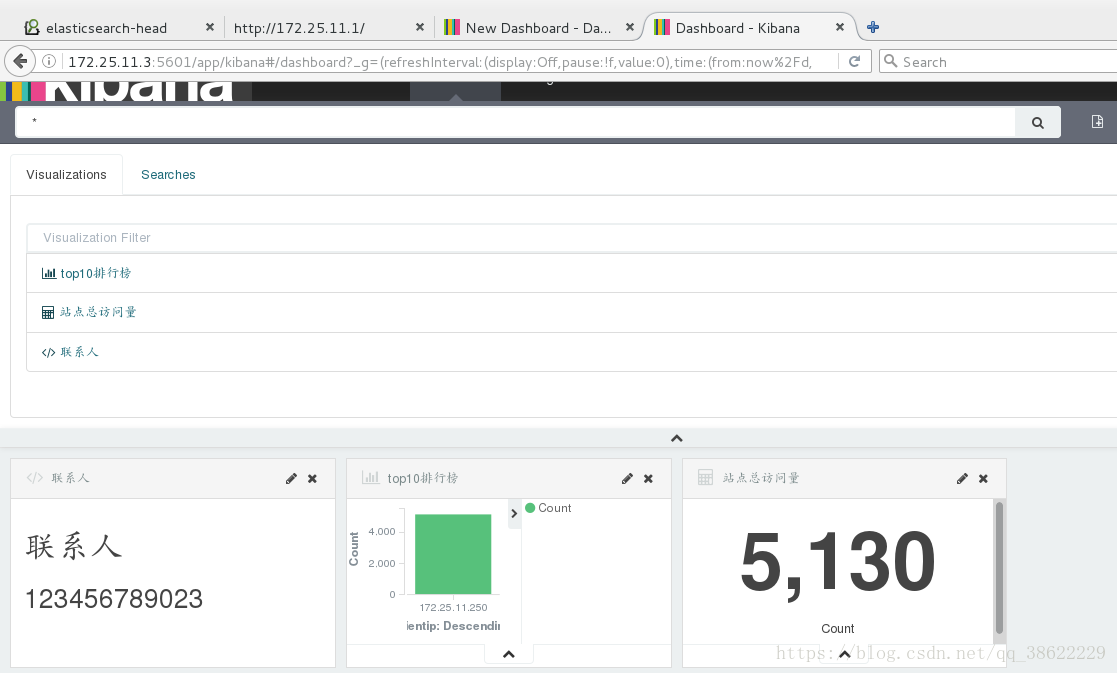
点击保存
在server1,2上执行/etc/init.d/logstash start将服务打入后台运行
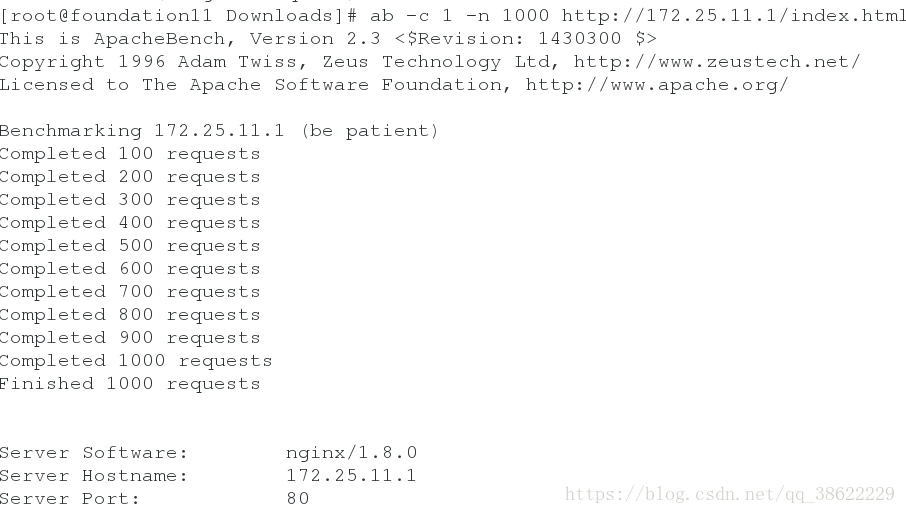
在一台主机上去访问此 主机(执行压测命令)
浏览器上设置刷新时间间隔(点击右上角–>点击5s,表示5s刷新一次)
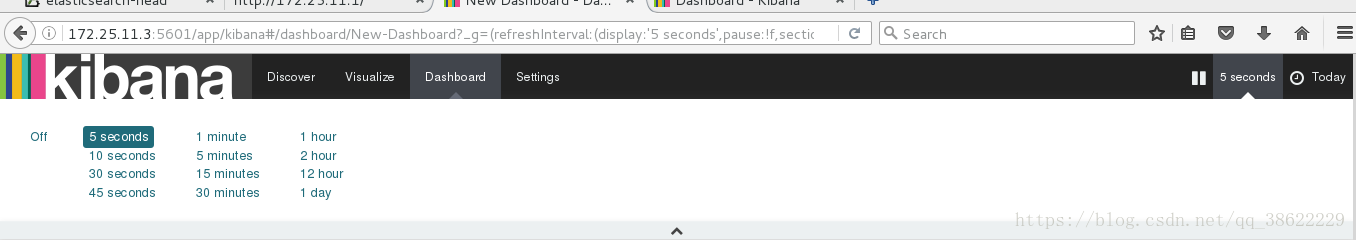
实现实时数据采集和展示


 854
854

 被折叠的 条评论
为什么被折叠?
被折叠的 条评论
为什么被折叠?
 到【灌水乐园】发言


