baroption = {
title: {
text: ''
},
tooltip: {
trigger: 'axis'
},
grid: {
bottom: '50'
},
calculable: true,
xAxis: [{
type: 'category',
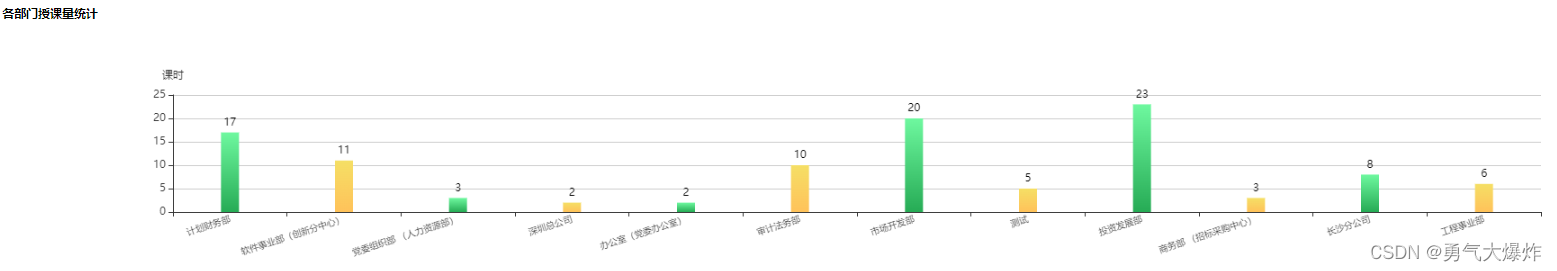
data: ["计划财务部", "软件事业部(创新分中心)", "党委组织部 (人力资源部)", "深圳总公司", "办公室(党委办公室)",
"审计法务部", "市场开发部", "测试", "投资发展部", "商务部 (招标采购中心)", "长沙分公司", "工程事业部"
],
axisLabel: {
rotate: 18,
textStyle: {
fontSize: '10',
}
}
}],
yAxis: [
{
name: '课时',
type: 'value'
}
],
series: [{
barWidth: '20',
name: '授课量',
itemStyle: {
normal: {
label: {
show: true, //开启显示
position: 'top', //在上方显示
textStyle: { //数值样式
color: '#000',
fontSize: 12
}
},
color: function(params) {
return colorList[params.dataIndex % 2]
}, //改变折线点的颜色
lineStyle: {
color: '#42B983' //改变折线颜色
}
}
},
backgroundStyle: {
color: 'rgba(42,176,90,0.3)'
},
type: 'bar',
data: [17, 11, 3, 2, 2, 10, 20, 5, 23, 3, 8, 6]
}]
};


 该文章描述了一个关于不同IT部门授课量的柱状图,使用了JavaScript图表库如ECharts,展示了各个部门的课时数据,旨在清晰呈现数据分布情况。


 被折叠的 条评论
为什么被折叠?
被折叠的 条评论
为什么被折叠?
 到【灌水乐园】发言


