


在当今快速发展的商业环境中,企业需要不断寻求提高效率和竞争力的方法。NSCOS企业级监控面板应运而生,它是一款专为企业设计的强大工具,旨在提供一个集中的、可视化的界面来监控关键业务指标(KPIs)。通过整合来自多个数据源的信息,该面板使管理层能够迅速识别趋势、异常情况,并作出即时反应。无论是在IT运维、市场营销还是财务管理方面,NSCOS都能帮助企业保持竞争优势,确保所有重要信息一目了然,从而简化复杂的决策过程。
01
Nacos开启metrics
$ cat /etc/kubernetes/addons/nacos/application.properties
#***********Expose prometheus and health **************************#
management.endpoints.web.exposure.include=*

$ kubectl -n nacos create configmap nacos-config --from-file=application.properties=/etc/kubernetes/addons/nacos/application.properties --dry-run -oyaml | kubectl apply -f -
W0105 20:22:11.085926    9899 helpers.go:692] --dry-run is deprecated and can be replaced with --dry-run=client.
configmap/nacos-config configured02
Prometheus采集Nacos指标
1、Prometheus采集Nacos数据
$ kubectl -n kube-system edit cm prometheus
    - job_name: nacos
      metrics_path: /nacos/actuator/prometheus
      scheme: http
      kubernetes_sd_configs:
      - role: endpoints
      relabel_configs:
      - action: keep
        source_labels: [__meta_kubernetes_namespace, __meta_kubernetes_endpoints_name, __meta_kubernetes_endpoint_port_name]
        regex: nacos;nacos;server
2、验证是否采集成功
$ curl -s $(kubectl -n kube-system get svc prometheus -ojsonpath='{.spec.clusterIP}:{.spec.ports[0].port}')/prometheus/api/v1/query --data-urlencode 'query=up{job=~"nacos"}' | jq '.data.result[] | {job: .metric.job, instance: .metric.instance ,status: .value[1]}'
{
  "job": "nacos",
  "instance": "10.244.85.245:8848",
  "status": "1"
}
{
  "job": "nacos",
  "instance": "10.244.217.98:8848",
  "status": "1"
}
{
  "job": "nacos",
  "instance": "10.244.135.143:8848",
  "status": "1"
}03
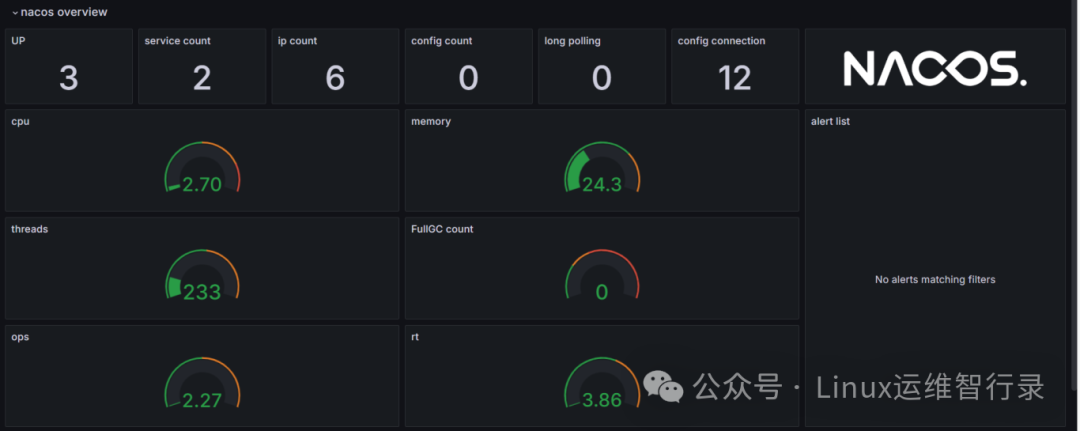
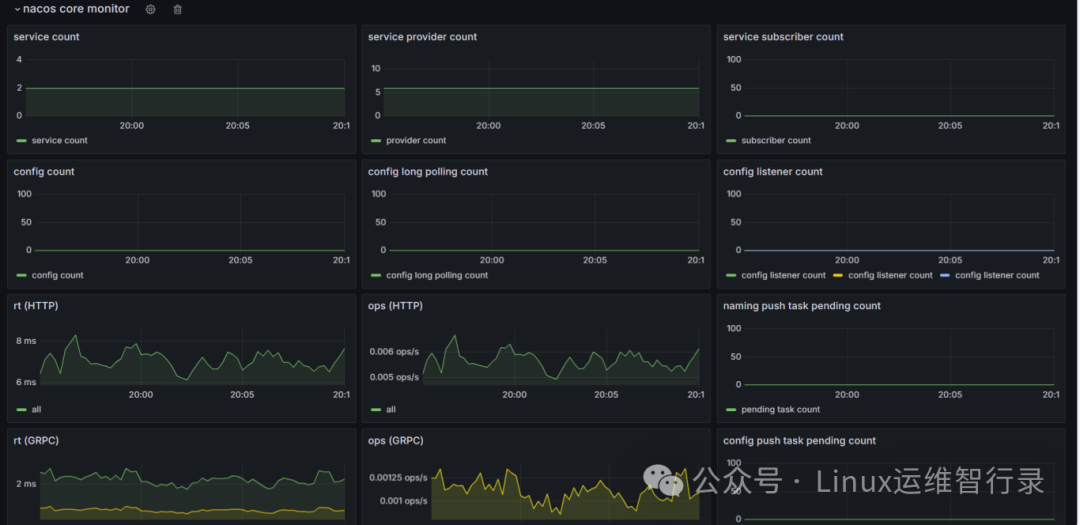
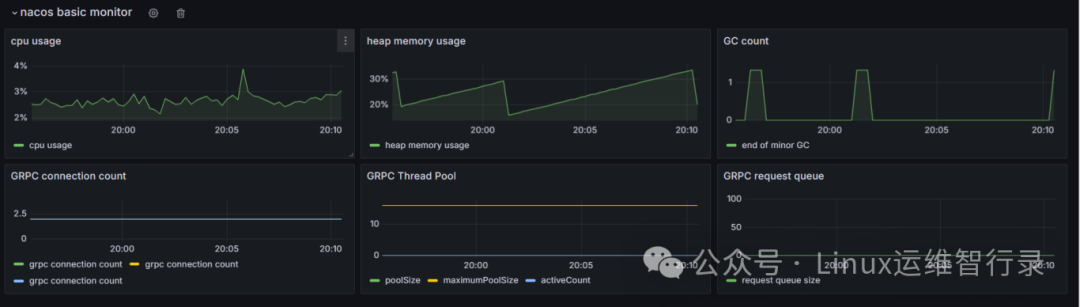
grafana添加Nacos监控面板
grafana上导入官网提供的dashboard文件,请查看https://github.com/nacos-group/nacos-template/blob/master/nacos-grafana-upper-2.4.json地址
效果图
04
结语
综上所述,NSCOS企业级监控面板是企业在数字化转型过程中的一大利器。它不仅提高了内部沟通效率,还促进了跨部门协作,最重要的是,它赋予了领导者更清晰的视角去理解公司运作状况,以便做出更加明智的战略选择。利用NSCOS,企业将能够在瞬息万变的市场中站稳脚跟,迎接未来的挑战。


 1476
1476

 被折叠的 条评论
为什么被折叠?
被折叠的 条评论
为什么被折叠?
 到【灌水乐园】发言


