


首先大概的配置流程先不说了,着重说一下容易出现的问题
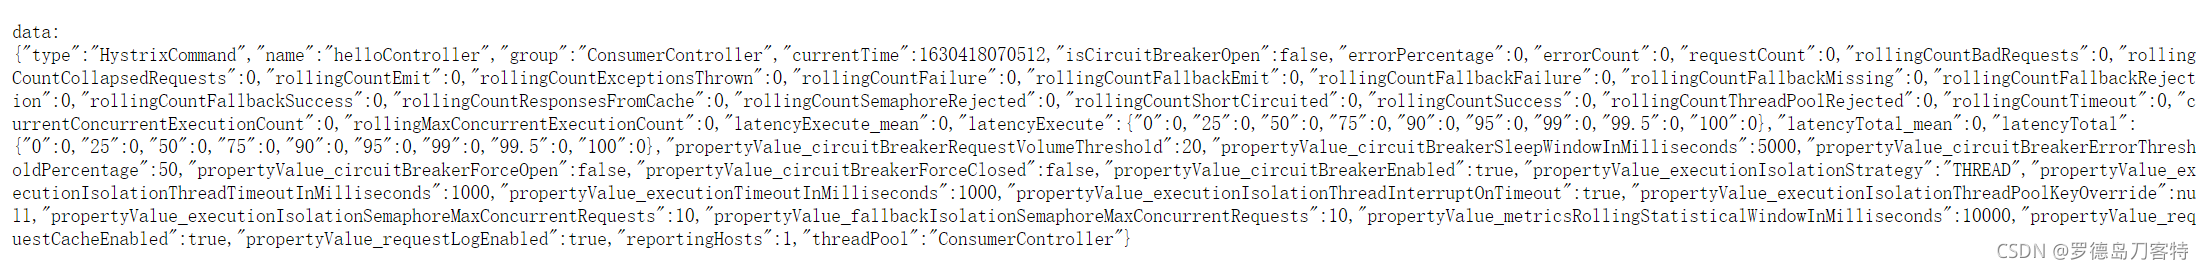
1、比如被监控的地址时https://abc:7000/actuator/hystrix.stream,如果点进去是不断弹出ping,则先需要请求一下该消费者的任意一个接口,然后再去刷新那个页面就可以了。如果还是不断弹出一连串的ping,此外什么也没有,那就需要在刚才访问的接口上添加@HystrixCommand注解,然后再去请求该接口,再去刷新https://abc:7000/actuator/hystrix.stream此页面,就会弹出一大串data,如下所示
2、如果访问hystrix监控页面,比如http://abc:7100/hystrix,出现Unable to connect to Command Metric Stream问题,去检查被监控的应用启动类有没有加上@EnableHyxtrix注解,如果有的话,再去查看控制台,如果出现
Origin parameter: http:/abc:7100/actuator/hystrix.stream is not in the allowed list of proxy host names. If it should be allowed add it to hystrix.dashboard.proxyStreamAllowList.
这样的错误,则去配置文件中添加如下配置
hystrix.dashboard.proxy-stream-allow-list=localhost需要注意的是这里localhost不需要加引号,而如果是yml文件,则需要添加(当时我在这找了好久错误)
hystrix:
    dashboard:
        proxy-stream-allow-list:"localhost"


 616
616

 被折叠的 条评论
为什么被折叠?
被折叠的 条评论
为什么被折叠?
 到【灌水乐园】发言


