selenium爬取空气质量数据

https://www.aqistudy.cn/
在这里插入图片描述
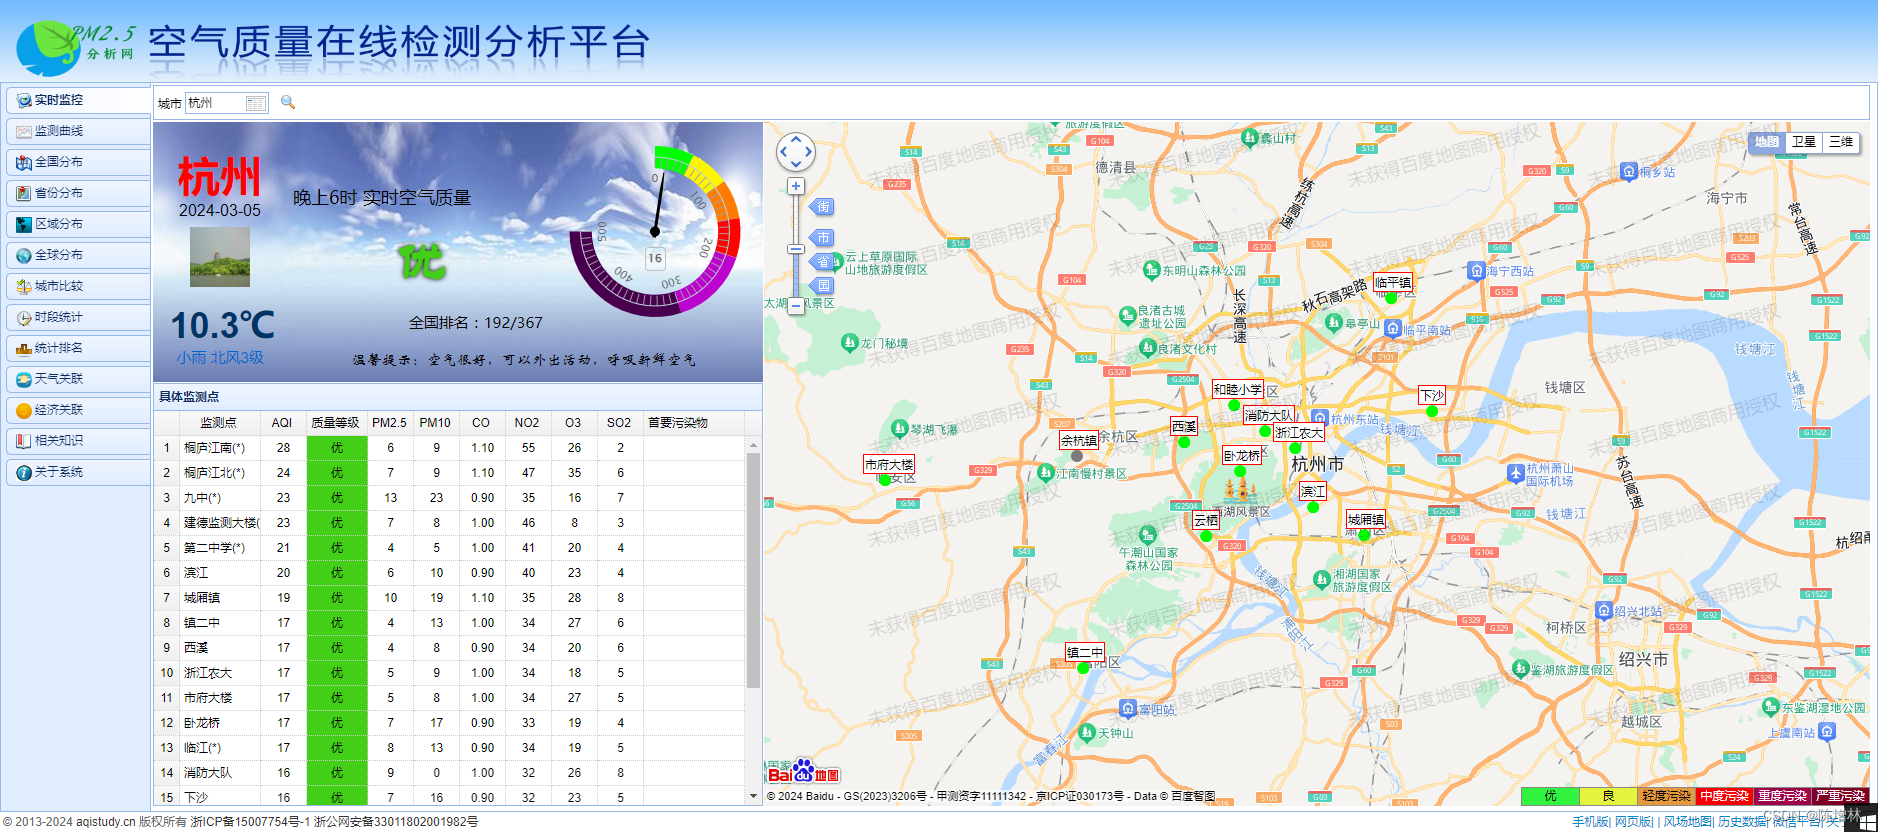
爬取指定城市在指定时间范围内的空气质量数据,并将数据保存为CSV文件。它首先从两个文本文件中读取城市信息和代理IP信息,然后提示用户输入爬取的起始年份、结束年份、起始月份和结束月份。接下来,它启动了Chrome浏览器的调试服务,并创建了一个Chrome驱动,用于自动化地访问指定的网页。之后,它定义了一个函数crawl_aqi_data(),用于爬取指定城市、指定年份和月份的空气质量数据,并将数据保存到本地文件。最后,它循环遍历所有城市和时间段,调用crawl_aqi_data()函数来完成数据爬取任务,完成后关闭浏览器,并输出"数据爬取完成。"

import os
import time
import subprocess
import pandas as pd
from selenium import webdriver
from selenium.webdriver.common.by import By
from fake_useragent import UserAgent
import random
# 读取城市信息
with open("city.txt", "r", encoding="utf-8") as file:
    cities = [line.strip() for line in file if line.strip()]

ips =[]
with open('ip.txt', 'r') as f:
    for line in f:
        ip = line.strip()
        ips.append(ip.strip())

# 输入爬取的起始年份、结束年份、起始月份和结束月份
start_year = int(input("请输入起始年份: "))
end_year = int(input("请输入结束年份: "))
start_month = int(input("请输入起始月份: "))
end_month = int(input("请输入结束月份: "))

# 启动Chrome浏览器调试服务
subprocess.Popen('cmd', shell=True)
subprocess.Popen('"chrome-win64\chrome.exe" --remote-debugging-port=9222', shell=True)

# 创建Chrome驱动
chrome_options = webdriver.ChromeOptions()
chrome_options.add_experimental_option("debuggerAddress", "localhost:9222")
chrome_options.add_argument('--headless')
chrome_options.add_argument('--disable‐gpu')
chrome_options.add_argument('--proxy-server=http://' + random.choice(ips))
chrome_options.add_argument(f"user-agent={UserAgent().random}")
driver = webdriver.Chrome(options=chrome_options)

def crawl_aqi_data(city, year, month):
    # 构建URL
    url = f"https://www.aqistudy.cn/historydata/daydata.php?city={city}&month={year}{month:02}"
    
    # 打开URL
    driver.get(url)
    time.sleep(2)  # 等待页面加载完成
    
    # 创建目录
    folder_path = os.getcwd()+f"\data\空气质量/{city}/{year}年"
    if not os.path.exists(folder_path):
        os.makedirs(folder_path)
    
    # 读取数据并保存到DataFrame
    rows = driver.find_elements(By.CSS_SELECTOR, ".row tr")
    data = []
    for row in rows:
        row_data = [cell.text for cell in row.find_elements(By.TAG_NAME, "td") if cell.text]
        if row_data:
            data.append(row_data)
    
    # 将数据转换为DataFrame
    df = pd.DataFrame(data)
    
    # 保存DataFrame为CSV文件
    file_path = f"{folder_path}/{year}{month:02}月.csv"
    df.to_csv(file_path, index=False, encoding="utf-8")
                
# 循环爬取指定城市、指定时间段的数据
for city in cities:
    for year in range(start_year, end_year + 1):
        for month in range(start_month, end_month + 1):
            crawl_aqi_data(city, year, month)
            
            
# 关闭浏览器
driver.quit()

print("数据爬取完成。")

在这里插入图片描述
数据可视化

import os
import pandas as pd
import matplotlib.pyplot as plt

# 指定数据文件夹路径
data_folder = os.path.join(os.getcwd(), 'data', '空气质量')
# 设置中文显示
plt.rcParams['font.sans-serif'] = ['SimHei']
plt.rcParams['axes.unicode_minus'] = False


# 读取CSV文件并加载数据
def load_data(file_path):
    if os.path.exists(file_path):
        if os.stat(file_path).st_size == 0:
            print(f"File '{file_path}' is empty.")
            return None
        df = pd.read_csv(file_path)
        return df
    else:
        print(f"File '{file_path}' does not exist.")
        return None

all_df=[]
# 遍历天气目录下的城市数据
for city_name in os.listdir(data_folder):
    city_dir = os.path.join(data_folder, city_name)
    if os.path.isdir(city_dir):
        # 遍历城市文件夹下的所有 CSV 文件
        for year in os.listdir(city_dir):
            year_dir = os.path.join(city_dir, year)
            for csv_file in os.listdir(year_dir):
                if csv_file.endswith(".csv"):
                    # 构建文件路径
                    file_path = os.path.join(year_dir, csv_file)

                    # 加载数据
                    df = load_data(file_path)
                    # 添加城市列
                    df['城市'] = city_name
                    all_df.append(df)
df = pd.concat(all_df, ignore_index=True)
# 可视化显示
plt.figure(figsize=(10, 6))

plt.plot(df['城市'], df['AQI'], marker='o', color='red', linestyle='-')
plt.xlabel('城市')
plt.ylabel('AQI')
plt.title('各城市空气质量对比')
plt.xticks(rotation=90)  # 旋转x轴标签,以便更好地显示城市名
plt.grid(True)  # 显示网格线
plt.tight_layout()  # 调整布局,防止标签重叠
plt.show()

在这里插入图片描述

应该改成日期横坐标,算了

爬取空气质量检测网的部分城市的历年每天质量数据 思路----------------------------------------- 从某城市的空气质量网页获取某市每月的链接,再爬取每个月的表格数据。连云港市:https://www.aqistudy.cn/historydata/daydata.php?city=连云港 连云港2014年5月的空气质量:https://www.aqistudy.cn/historydata/daydata.php?city=连云港&month=2014-05 遇到的问题----------------------------------------- 获取的网页中的表格数据隐藏,尝试requests无法获取。判断可能是动态加载的网页 尝试----------------------------------------- 1. 通过XHR,js查找隐藏数据的加载网页,没有找到。 2. 使用phantomjs.get() result=pd.read_html ,可以获得隐藏的表格数据,但是并不稳定,只是偶尔出现加载的表格数据,无法大规模的获取 解决方法----------------------------------------- 查找资料得知这个网站的表格数据在Console里的items中, 使用selenium的webdriver.firefox(),driver.execute_script("return items") 数据可获得。 仍遇到的问题:----------------------------------------- 爬取一个网页可获得数据,但是连续的获取网页,会出现两个错误。 1.Message: ReferenceError: items is not defined 2.connection refused 解决方法: 1.connection refused问题,可能是网页开太多,使用driver.quit() 2. 如果 execute_script 还是出错,可尝试pd.read_html获取信息。之前用phantomjs获取的时候输出空的表格,可能由于加载不够,用 Waite直到table出现之后再获取网页 Element=wait.until(EC.element_to_be_clickable((By.XPATH,"/html/body/div[3]/div[1]/div[1]/table/tbody"))) 3.之后出现偶尔出现输出为空,使用循环,如果输出表格为空,再重新获取。 if len(result)>1: filename = str(month) + '.xls' result.to_excel('E:\python\案例程序\data\\' + filename) print('成功存入'+filename) driver.quit() else: driver.quit() return getdata(monthhref,month)
评论
添加红包

请填写红包祝福语或标题

红包个数最小为10个

红包金额最低5元

当前余额3.43前往充值 >
需支付:10.00
成就一亿技术人!
领取后你会自动成为博主和红包主的粉丝 规则
hope_wisdom
发出的红包

打赏作者

陈增林

你的鼓励将是我创作的最大动力

¥1 ¥2 ¥4 ¥6 ¥10 ¥20
扫码支付:¥1
获取中
扫码支付

您的余额不足,请更换扫码支付或充值

打赏作者

实付
使用余额支付
点击重新获取
扫码支付
钱包余额 0

抵扣说明:

1.余额是钱包充值的虚拟货币,按照1:1的比例进行支付金额的抵扣。
2.余额无法直接购买下载,可以购买VIP、付费专栏及课程。

余额充值