


 本文介绍如何使用uCharts库将折线图转换为更平滑的曲线图,通过调整配置项实现数据可视化效果的优化。
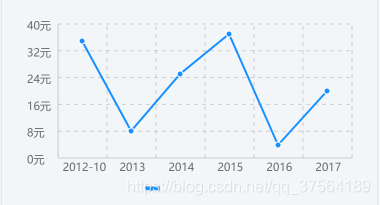
这里记录一下 折线图
根据官网给的折线demo 出来的效果就是
<template>
	<view class="transaction">
		<view class="canvas"><canvas canvas-id="canvasLine" id="canvasLine" class="charts"></canvas></view>
	</view>
</template>

<script>
import uCharts from '@/js_sdk/u-charts/u-charts/u-charts.js';
var _self;
var canvasLine = null;
export default {
	name: 'transaction',
	data() {
		return {
			cWidth: '',
			cHeight: '',
			pixelRatio: 1,
			serverData: ''
		};
	},
	methods: {
		getServerData() {
			let json = {
				success: true,
				data: {
					LineA: {
						categories: ['2012-10', '2013', '2014', '2015', '2016', '2017'],
						series: [
							{
								name: '',
								data: [35, 8, 25, 37, 4, 20],
								type: 'line',
								style: 'curve',
								color: '#1890ff'
							}
						]
					}
				}
			};
			let LineA = { categories: [], series: [] };
			//这里我后台返回的是数组,所以用等于,如果您后台返回的是单条数据,需要push进去
			LineA.categories = json.data.LineA.categories;
			LineA.series = json.data.LineA.series;
			_self.showLineA('canvasLine', LineA);
		},
		showLineA(canvasId, chartData) {
			canvasLine = new uCharts({
				$this: _self,
				canvasId: canvasId,
				type: 'line',
				fontSize: 11,
				legend: { show: true },
				dataLabel: false,
				dataPointShape: true,
				background: '#FFFFFF',
				pixelRatio: _self.pixelRatio,
				categories: chartData.categories,
				series: chartData.series,
				animation: true,
				xAxis: {
					type: 'grid',
					gridColor: '#CCCCCC',
					gridType: 'dash',
					dashLength: 8
				},
				yAxis: {
					gridType: 'dash',
					gridColor: '#CCCCCC',
					dashLength: 8,
					splitNumber: 5,
					format: val => {
						return val.toFixed(0) + '元';
					}
				},
				width: _self.cWidth * _self.pixelRatio,
				height: _self.cHeight * _self.pixelRatio,
				extra: {
					line: {
						type: 'straight'
					}
				}
			});
		}
	},
	onLoad() {
		_self = this;
		//#ifdef MP-ALIPAY
		uni.getSystemInfo({
			success: function(res) {
				if (res.pixelRatio > 1) {
					_self.pixelRatio = 2;
				}
			}
		});
		//#endif
		this.cWidth = uni.upx2px(690);
		this.cHeight = uni.upx2px(400);
		this.getServerData();
	},
	onShow() {}
};
</script>

<style scoped lang="scss">
/*样式的width和height一定要与定义的cWidth和cHeight相对应*/
.transaction {
	.canvas,
	.charts {
		width: 690upx;
		height: 400upx;
		margin: 30rpx auto;
	}
}
</style>
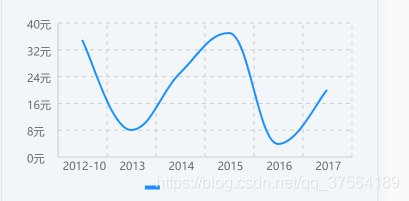
不过有时候 这直线不够圆润 想换成曲线 ,这个时候 只需要修改几个配置就可以了 把type 从line 变成 min 把 series里的style 变成 curve 就可以了
<template>
	<view class="transaction">
		<view class="canvas"><canvas canvas-id="canvasLine" id="canvasLine" class="charts"></canvas></view>
	</view>
</template>

<script>
import uCharts from '@/js_sdk/u-charts/u-charts/u-charts.js';
var _self;
var canvasLine = null;
export default {
	name: 'transaction',
	data() {
		return {
			cWidth: '',
			cHeight: '',
			pixelRatio: 1,
			serverData: ''
		};
	},
	methods: {
		getServerData() {
			let json = {
				success: true,
				data: {
					LineA: {
						categories: ['2012-10', '2013', '2014', '2015', '2016', '2017'],
						series: [
							{
								name: '',
								data: [35, 8, 25, 37, 4, 20],
								type: 'line',
								style: 'curve', //这里的类型改成曲线 curve  默认是 straight直线
								color: '#1890ff'
							}
						]
					}
				}
			};
			let LineA = { categories: [], series: [] };
			LineA.categories = json.data.LineA.categories;
			LineA.series = json.data.LineA.series;
			_self.showLineA('canvasLine', LineA);
		},
		showLineA(canvasId, chartData) {
			canvasLine = new uCharts({
				$this: _self,
				canvasId: canvasId,
				type: 'mix',   // 这里的类型从 line 换成 mix
				fontSize: 11,
				legend: { show: true },
				dataLabel: false,
				dataPointShape: true,
				background: '#FFFFFF',
				pixelRatio: _self.pixelRatio,
				categories: chartData.categories,
				series: chartData.series,
				animation: true,
				xAxis: {
					type: 'grid',
					gridColor: '#CCCCCC',
					gridType: 'dash',
					dashLength: 8
				},
				yAxis: {
					gridType: 'dash',
					gridColor: '#CCCCCC',
					dashLength: 8,
					splitNumber: 5,
					format: val => {
						return val.toFixed(0) + '元';
					}
				},
				width: _self.cWidth * _self.pixelRatio,
				height: _self.cHeight * _self.pixelRatio,
				extra: {
					line: {
						type: 'straight'
					}
				}
			});
		}
	},
	onLoad() {
		_self = this;
		//#ifdef MP-ALIPAY
		uni.getSystemInfo({
			success: function(res) {
				if (res.pixelRatio > 1) {
					_self.pixelRatio = 2;
				}
			}
		});
		//#endif
		this.cWidth = uni.upx2px(690);
		this.cHeight = uni.upx2px(400);
		this.getServerData();
	},
	onShow() {}
};
</script>

<style scoped lang="scss">
.transaction {
/*样式的width和height一定要与定义的cWidth和cHeight相对应*/
	.canvas,
	.charts {
		width: 690upx;
		height: 400upx;
		margin: 30rpx auto;
	}
}
</style>


 4863
4863

 被折叠的 条评论
为什么被折叠?
被折叠的 条评论
为什么被折叠?
 到【灌水乐园】发言


