echarts 动态传入数据(含有时间) 折线图angular
首先使用原生的js和echarts编写,然后使用angular编写(更改了原生中的一些bug),带有详细注释
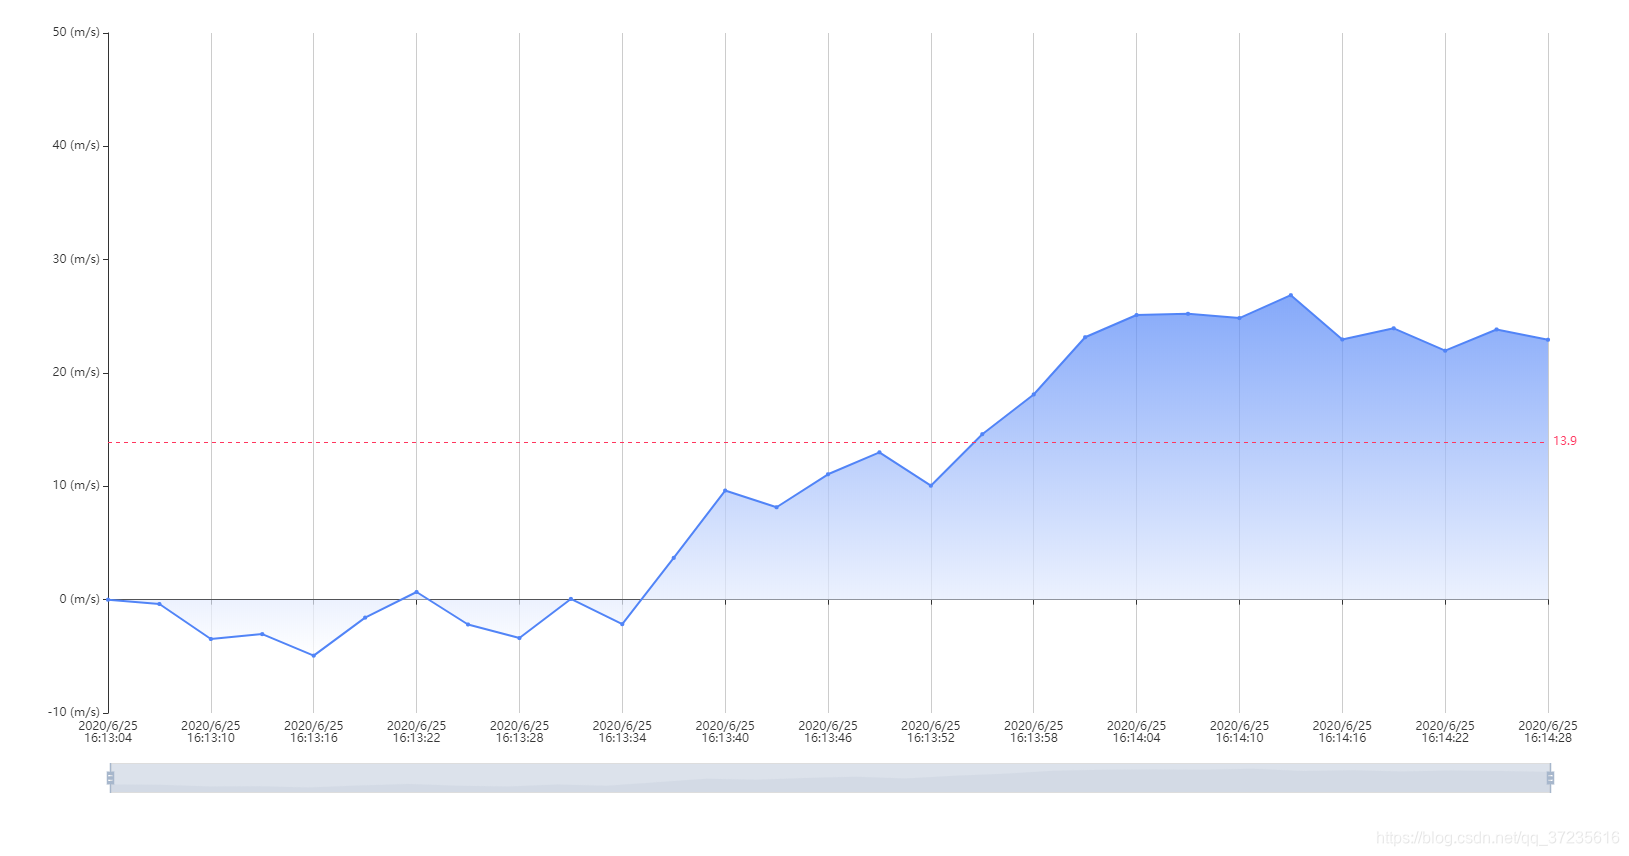
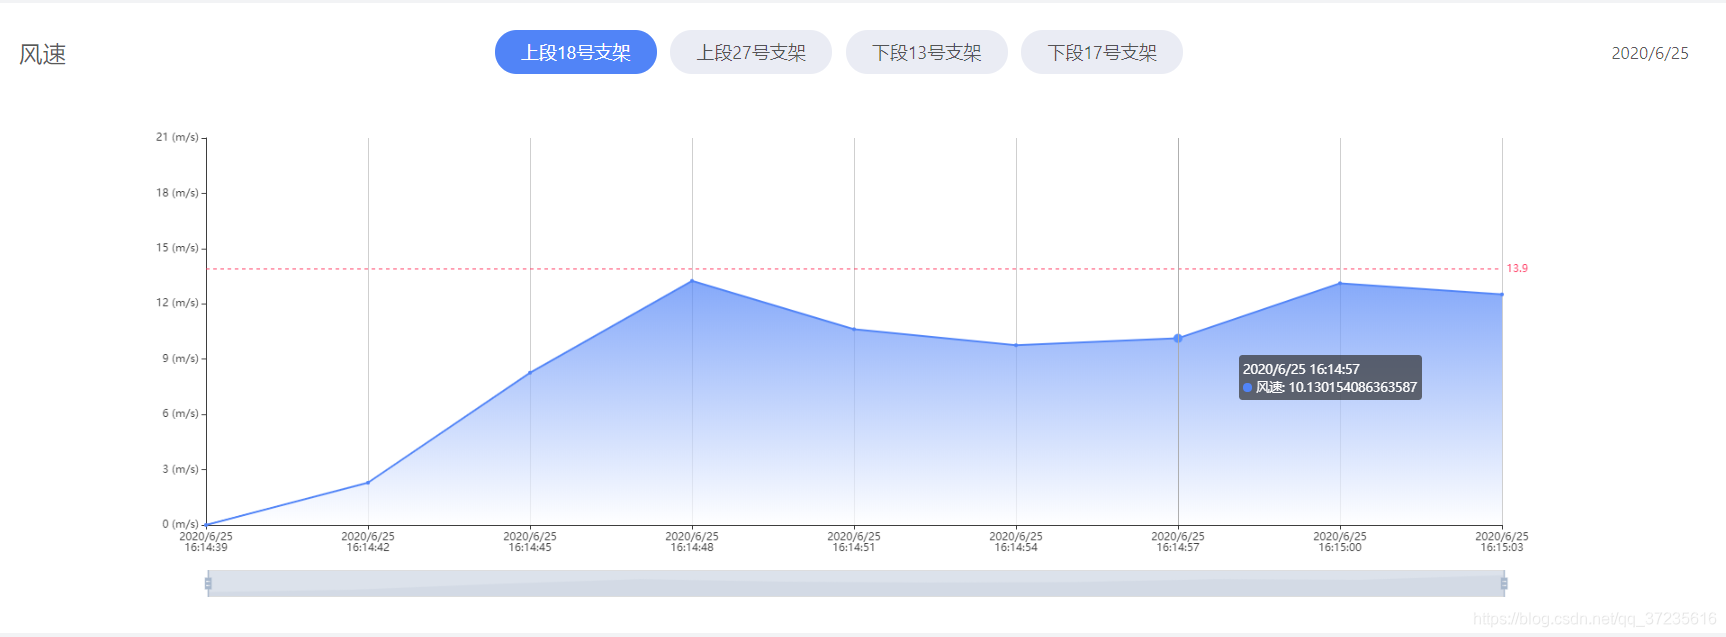
实现效果:
控制刷新时间,获取当前时间导入,按时间更新数据,数据数组动态更新(获取异步数据再另外编写),实现angular编写
效果图


踩坑
1.使用ngx-echarts总有问题,和ngx_echarts_config有关,一气之下就只用了echarts
2.必须给图表设置定长,不能设置百分比,否则会报错
3.动态更新数据数组data后,必须
this.myChart.setOption(this.chartOption);
来更新数据图表
4.将时间date转化为平常模式
this.now = this.now.toLocaleDateString() + '\n' + this.now.getHours() + this.now.toLocaleTimeString().substr(-6, 6);
画图过程
① 获取到div中的chart的id,如果用ngx-echarts,可以使用[option]=“option”
② 设置时间数组和数据数组,以及初始化的函数
③ 假设数组长度为30,先设置前30个数,再导入新数的同时,使用shift去掉第一个数,达到动态展示数据的效果
原生代码(可直接复制使用)
<!DOCTYPE html>
<html>
<head>
    <meta charset="utf-8">
    <title>ECharts</title>
    <!-- 引入 echarts.js -->
    <script type="text/javascript" src="https://echarts.baidu.com/gallery/vendors/echarts/echarts.min.js"></script>
    <script src="https://apps.bdimg.com/libs/jquery/2.1.4/jquery.min.js"></script>
</head>
<body>
<!-- 为ECharts准备一个具备大小(宽高)的Dom -->
<div id="main" style="width: 1800px;height:800px;"></div>
<script type="text/javascript">
    // 基于准备好的dom,初始化echarts实例
    var myChart = echarts.init(document.getElementById('main'));

    // 指定图表的配置项和数据
    // var base = +new Date(2014, 9, 3);
    // var base = +new Date();
    var oneDay = 24 * 3600 * 1000;
    var threeSecond = 3000;
    var tenSecond = 10000;
    var date = [];
    var queueLength = 30; // 队列长度
    var refreshTimeNormal = 3000; // 正常刷新时间
    var refreshTimeAlarm = 1000; // 报警信号刷新时间

    // var data = [Math.random() * 150];
    var data = [0];
    // 设置初试时间
    var initTime = new Date(); // 获得当前时间
    // 此处是将时间戳改为正常Date格式时间
    var now = new Date(initTime.getTime()-queueLength*refreshTimeNormal); // 当前时间减去前几分钟,以填充数据
    function addData(shift) {
        // now = [now.getFullYear(), now.getMonth() + 1, now.getDate()].join('/');
        // 格式化时间,转为
        // now = now.toLocaleDateString() + ' ' + now.getHours() + now.toLocaleTimeString().substr(-6, 6);
        now = now.toLocaleDateString() + '\n' + now.getHours() + now.toLocaleTimeString().substr(-6, 6);
        date.push(now); // 填充横坐标数组 时间
        // data.push((Math.random() - 0.4) * 10 + data[data.length - 1]); // 填充纵坐标

        if (shift) {
            data.push((Math.random() - 0.4) * 10 + data[data.length - 1]); // 填充纵坐标
            date.shift();
            data.shift();
            // 删除第一项
        } else {
            data.push((Math.random() - 0.4) * 10 + data[data.length - 1]); // 填充纵坐标
            // data.push(0); // 初始化填充纵坐标
        }
        // 控制每次加多少一段时间
        now = new Date(+new Date(now) + threeSecond);
    }

    // 先赋值20个,同时数组上限为20
    for (var i = 1; i < queueLength; i++) {
        addData();
    }

    option = {
        grid : {
            top : 40,    //距离容器上边界40像素
            bottom: 80   //距离容器下边界30像素
        },
        xAxis: { // x轴设置
            type: 'category',
            boundaryGap: false,
            splitLine:{show: true},//去除网格线
            data: date,
            // splitNumber: 24, // 横坐标设置24个间隔
            // axis
        },
        yAxis: { // y轴设置
            boundaryGap: [0, '50%'],
            splitLine:{show: false},//去除网格线
            type: 'value',
            axisLabel: {
                formatter: '{value} (m/s)'       //给Y轴上的刻度加上单位
            },
        },
        dataZoom: [ // 数据滑块设置
            {
                type: 'slider',//数据滑块
                start: 0, // 起始0
                end: 100, // 终止100
                minSpan: 8,
                bottom: '0%',
                dataBackground: {
                    lineStyle: {
                        color: '#F0F2F5'
                    },
                    areaStyle: {
                        color: '#F0F2F5',
                        opacity: 1,
                    }
                },
                // fillerColor:'rgba(255,255,255,.6)'
            },
            {
                type: 'inside'//使鼠标在图表中时滚轮可用
            }
        ],
        series: [ // 曲线设置
            {
                data: data,
                name: '风速',
                type: 'line',
                // smooth: true,
                symbol: 'circle', // 空心小圆设置 ECharts 提供的标记类型包括 'circle', 'rect', 'roundRect', 'triangle', 'diamond', 'pin', 'arrow', 'none'
                stack: 'a',
                areaStyle: { // 区域设置
                    color: {
                        type: 'linear',
                        x: 0,
                        y: 0,
                        x2: 0,
                        y2: 1,
                        colorStops: [{
                            offset: 0, color: "#5184F7" // 100% 处的颜色
                        }, {
                            offset: 1, color: "#ffffff"  // 0% 处的颜色
                        }],
                        global: false // 缺省为 false
                    }
                },
                itemStyle: { // 曲线设置
                    normal: {
                        color: "#5184F7", //圆心圈颜色
                        lineStyle: {
                            color: "#5184F7"
                        }
                    }
                },
                markLine: { // 警戒线
                    symbol:"none",
                    label: "middle", // 将警示值放在哪个位置,三个值“start”,"middle","end"  开始
                    data: [
                        {
                            name: '13.9m/s警戒线',
                            // type: 'average',
                            lineStyle: {
                                color: "#FF365F"
                            },
                            yAxis: 13.9
                        }
                    ],
                },
            },
        ],
        tooltip: {
            trigger: 'axis',
        },
    };

    setInterval(function () {
        addData(true);
        myChart.setOption({
            xAxis: {
                data: date,
            },
            series: [{
                name: '风速',
                data: data
            }]
        });
    }, refreshTimeNormal);
    // 使用刚指定的配置项和数据显示图表。
    myChart.setOption(option);
</script>
</body>
</html>
angualr实现代码:
HTML:
<div class="chart-content" id="wind-chart"></div><div class="chart-content" id="wind-chart"></div>
css:
.chart-content {
  width: 1800px;
  height: 550px;
}
ts:
import {Component, OnInit} from '@angular/core';

@Component({
    selector: 'app-wind-chart',
    templateUrl: './wind-chart.component.html',
    styleUrls: ['./wind-chart.component.scss']
})
export class WindChartComponent implements OnInit {

    // @ts-ignore
    myChart: echarts.ECharts;
    date = []; // 时间数组
    data = [0]; // 数据数组 一定要有个0!
    queueLength = 10; // 队列长度
    refreshTimeNormal = 3000; // 正常刷新时间
    refreshTimeAlarm = 1000; // 报警信号刷新时间
    initTime = new Date(); // 获得当前时间
    // 此处是将时间戳改为正常Date格式时间
    now; // 将当前时间进行处理,减去前几分钟
    chartOption = { // chart的option参数
        grid: {
            top: 40,  // 距离容器上边界40像素
            bottom: 80   // 距离容器下边界30像素
        },
        xAxis: { // x轴设置
            type: 'category',
            boundaryGap: false,
            splitLine: {show: true}, // 去除网格线
            data: this.date,
            // splitNumber: 24, // 横坐标设置24个间隔
            // axis
        },
        yAxis: { // y轴设置
            boundaryGap: [0, '50%'],
            splitLine: {show: false}, // 去除网格线
            type: 'value',
            axisLabel: {
                formatter: '{value} (m/s)'       // 给Y轴上的刻度加上单位
            },
        },
        dataZoom: [ // 数据滑块设置
            {
                type: 'slider', // 数据滑块
                start: 0, // 起始0
                end: 100, // 终止100
                minSpan: 8,
                bottom: '0%',
                dataBackground: {
                    lineStyle: {
                        color: '#F0F2F5'
                    },
                    areaStyle: {
                        color: '#F0F2F5',
                        opacity: 1,
                    }
                },
                // fillerColor:'rgba(255,255,255,.6)'
            },
            {
                type: 'inside'// 使鼠标在图表中时滚轮可用
            }
        ],
        series: [ // 曲线设置
            {
                type: 'line',
                data: this.data,
                name: '风速',
                // smooth: true,
                symbol: 'circle', // 空心小圆设置 ECharts 提供的标记类型包括 'circle', 'rect', 'roundRect', 'triangle', 'diamond', 'pin', 'arrow', 'none'
                stack: 'a',
                areaStyle: { // 区域设置
                    color: {
                        type: 'linear',
                        x: 0,
                        y: 0,
                        x2: 0,
                        y2: 1,
                        colorStops: [{
                            offset: 0, color: '#5184F7' // 100% 处的颜色
                        }, {
                            offset: 1, color: '#ffffff'  // 0% 处的颜色
                        }],
                        global: false // 缺省为 false
                    }
                },
                itemStyle: { // 曲线设置
                    normal: {
                        color: '#5184F7', // 圆心圈颜色
                        lineStyle: {
                            color: '#5184F7'
                        }
                    }
                },
                markLine: { // 警戒线
                  symbol: 'none',
                  label: 'middle', // 将警示值放在哪个位置,三个值“start”,"middle","end"  开始
                  data: [
                    {
                      name: '13.9m/s警戒线',
                      // type: 'average',
                      lineStyle: {
                        color: '#FF365F'
                      },
                      // yAxis: {
                      //   data: ['13.9'],
                      // },
                      yAxis: 13.9,
                    }
                  ],
                },
            },
        ],
        tooltip: {
            trigger: 'axis',
        },
    };

    constructor() {
    }

    ngOnInit() {
        // @ts-ignore
        this.myChart = echarts.init(document.getElementById('wind-chart')); // 初始化图标
        this.now = new Date(this.initTime.getTime() - this.queueLength * this.refreshTimeNormal); // 当前时间减去前几分钟,以填充数据
        // 先对数组进行初始赋值
        this.initData();
        this.updateDate();
    }

    addData(shift) {
        // now = [now.getFullYear(), now.getMonth() + 1, now.getDate()].join('/');
        // 格式化时间,转为
        // now = now.toLocaleDateString() + ' ' + now.getHours() + now.toLocaleTimeString().substr(-6, 6);
        this.now = this.now.toLocaleDateString() + '\n' + this.now.getHours() + this.now.toLocaleTimeString().substr(-6, 6);
        this.date.push(this.now); // 填充横坐标数组 时间
        // this.data.push((Math.random() - 0.4) * 10 + this.data[this.data.length - 1]); // 填充纵坐标

        if (shift) {
            this.data.push((Math.random() - 0.4) * 10 + this.data[this.data.length - 1]); // 填充纵坐标
            this.date.shift();
            this.data.shift();
            // 删除第一项
        } else {
            this.data.push((Math.random() - 0.4) * 10 + this.data[this.data.length - 1]); // 填充纵坐标
            // this.data.push(0); // 初始化填充纵坐标
        }
        // 控制每次加多少一段时间
        this.now = new Date(+new Date(this.now) + this.refreshTimeNormal);
        // @ts-ignore
        this.myChart.setOption(this.chartOption);
    }

    initData() { // 初始化数据
        for (let i = 1; i < this.queueLength; i++) {
            this.addData(false);
        }
    }

    updateDate() { // 更新数据
        setInterval(() => { // 自动更新数据内容
            this.addData(true);
            // setTimeout(() => { // 设置延时,异步数据
            //     this.myChart.setOption({
            //         xAxis: {
            //             data: this.date,
            //         },
            //         series: [{
            //             type: 'line',
            //             name: '风速',
            //             data: this.data
            //         }]
            //     });
            // }, 500);
            this.myChart.setOption({
                xAxis: {
                    data: this.date,
                },
                series: [{
                    type: 'line',
                    name: '风速',
                    data: this.data
                }]
            });
        }, this.refreshTimeNormal);
        // @ts-ignore
        this.myChart.setOption(this.chartOption); // 注意此处只是将data更新,必须要写一遍setOption,否则会报错!
    }

}


 本文介绍如何使用Angular和ECharts实现动态更新折线图,包括控制刷新时间、获取当前时间、按时间更新数据等功能,适用于实时数据展示场景。


 9441
9441

 被折叠的 条评论
为什么被折叠?


