


 本文档描述了在搭建Spring Cloud Hystrix Dashboard时遇到的加载问题。启动Hystrix监控服务端和被监控的客户端后,Hystrix.stream页面持续加载。问题在于需要手动请求被监控的服务端口(例如http://localhost:9000/ribbon-consumer/),之后监控页面才会显示请求信息。
搭建:
监控服务端
     <!--断路器-->
            <dependency>
                <groupId>org.springframework.cloud</groupId>
                <artifactId>spring-cloud-starter-hystrix</artifactId>
            </dependency>
            <!-- 仪表盘-->

            <dependency>
                <groupId>org.springframework.cloud</groupId>
                <artifactId>spring-cloud-starter-hystrix-dashboard</artifactId>
            </dependency>
            <!--监控-->
            <dependency>
                <groupId>org.springframework.boot</groupId>
                <artifactId>spring-boot-actuator</artifactId>
            </dependency>
 @EnableHystrixDashboard
 @SpringBootApplication
 public class Application {
     public static void main(String[] args) {
         new SpringApplicationBuilder(Application.class).web(true).run(args);
     }
 }
  spring.application.name = dashboard
  server.port=8999
被监控的客户端
      <!--容错保护-->
          <dependency>
              <groupId>org.springframework.cloud</groupId>
              <artifactId>spring-cloud-starter-hystrix</artifactId>
          </dependency>


          <!--监控-->
          <dependency>
              <groupId>org.springframework.boot</groupId>
              <artifactId>spring-boot-actuator</artifactId>
          </dependency>
//服务发现的能力
@EnableCircuitBreaker
启动之前的项目
ribbon-consumer
本机搭建spring cloub的高可用Eureka 出现available-replicas为空
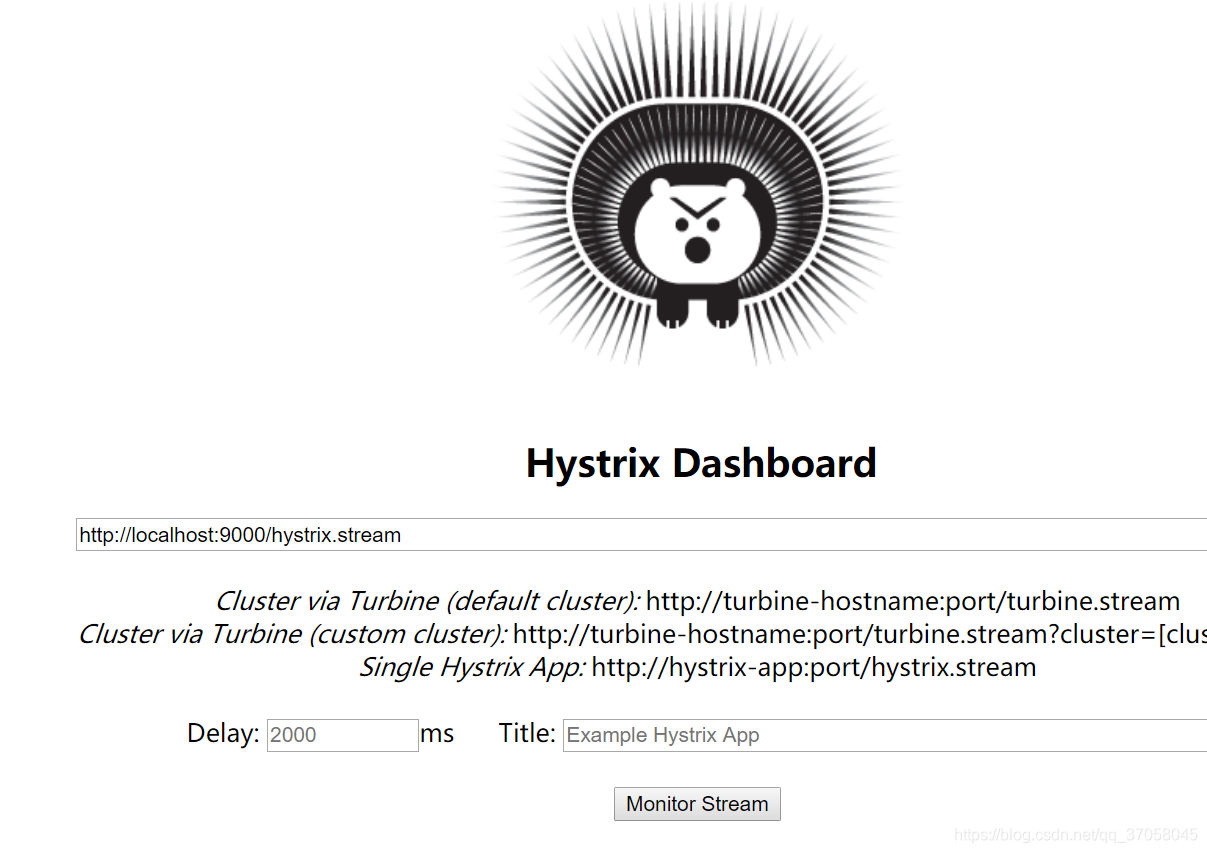
新建的dashboard监控服务端
启动监控后进入hystrix.stream页面,发现一直在加载中
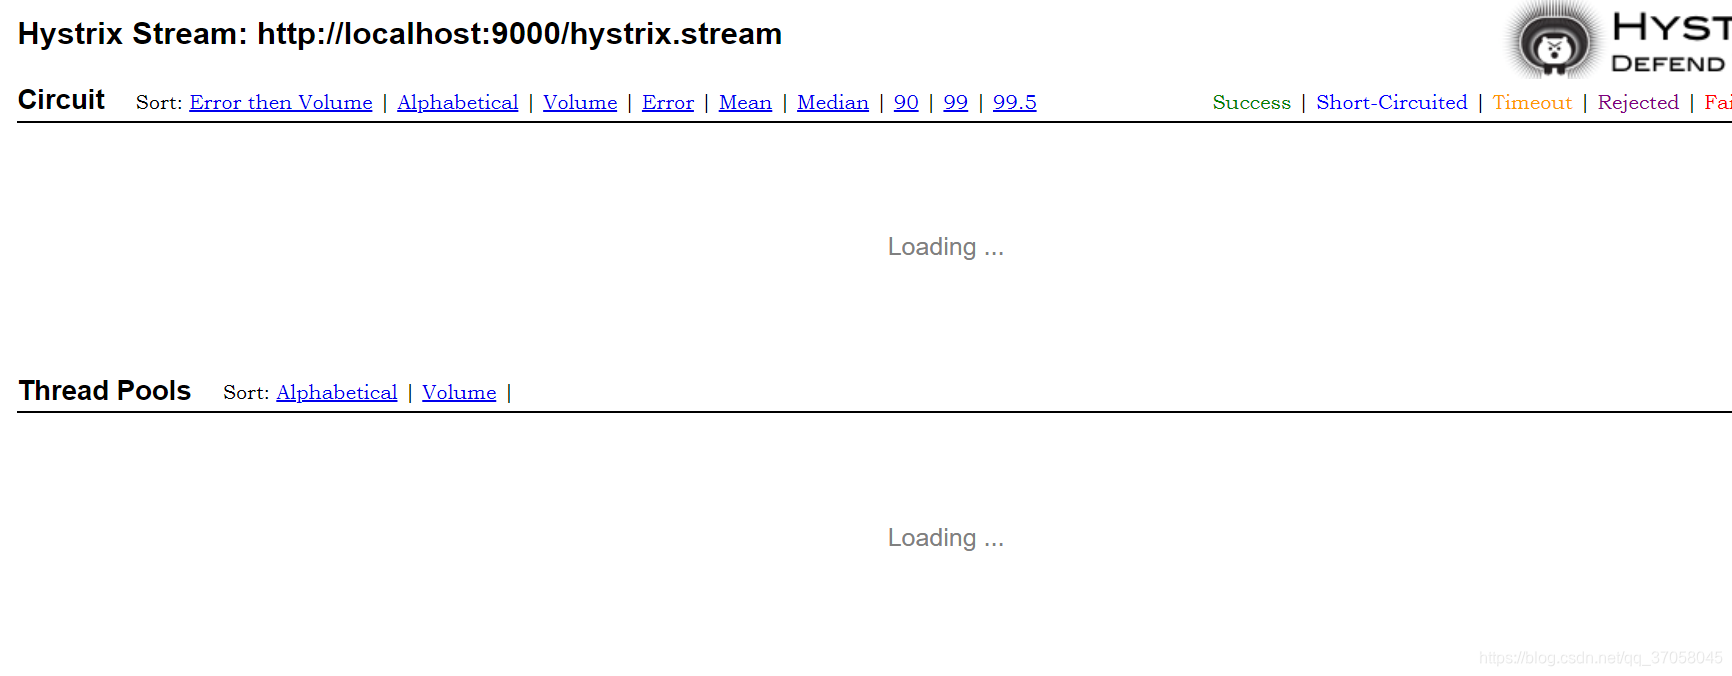
原因:刚启动是这样的,需要手动请求要监控的端口服务
http://localhost:9000/ribbon-consumer/
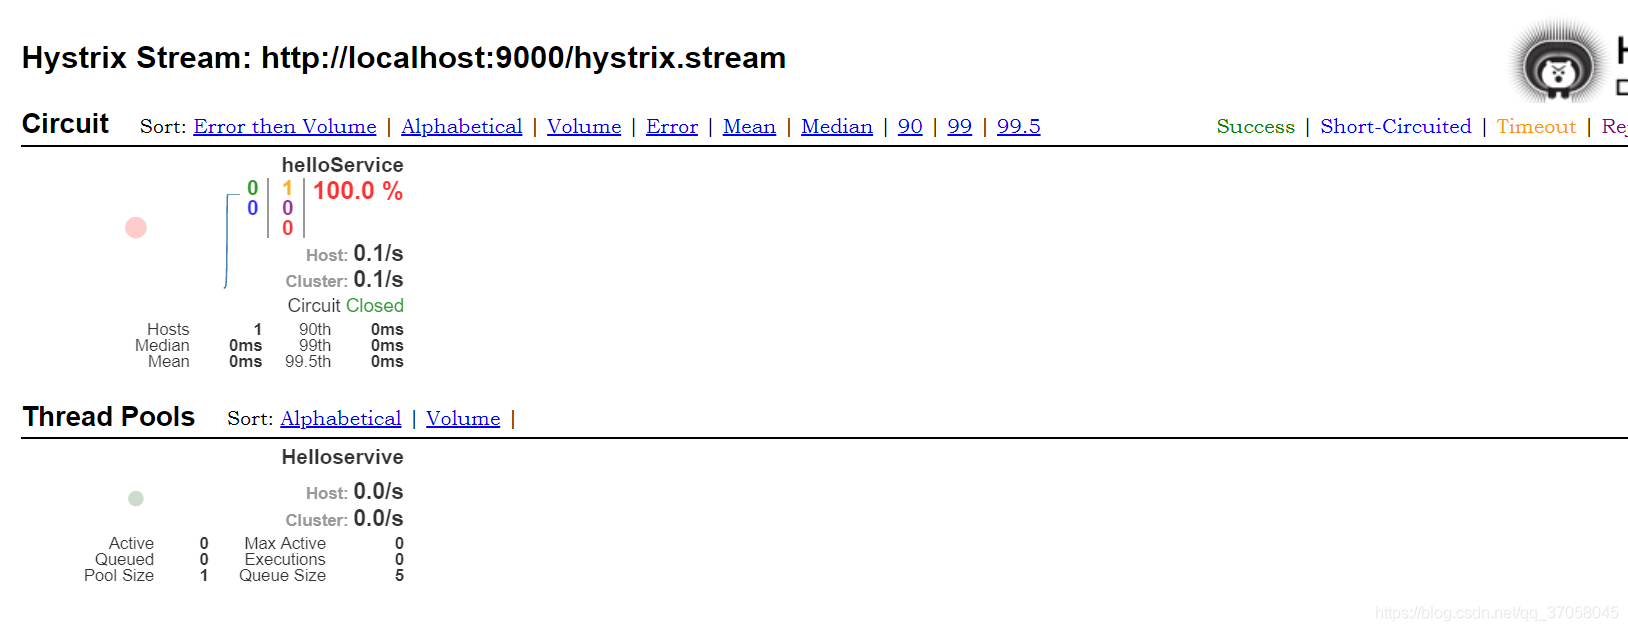
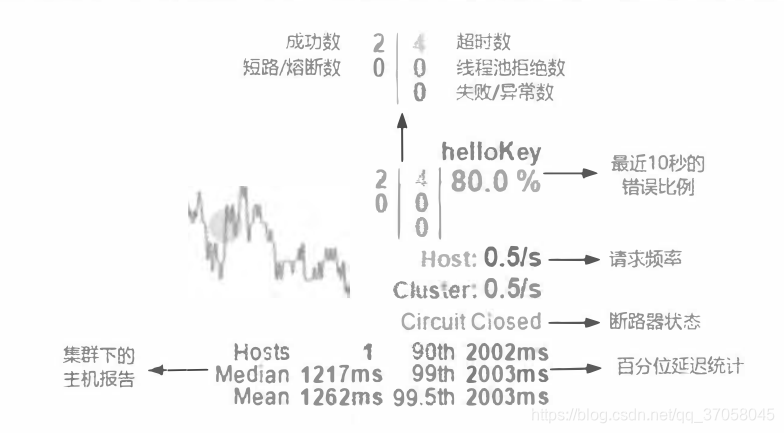
然后监控页面显示刚才的请求信息


 594
594

 被折叠的 条评论
为什么被折叠?
被折叠的 条评论
为什么被折叠?
 到【灌水乐园】发言


