


图表用于以图形格式表示数据。 以下是Ext JS提供的不同图表:
| 编号 | 图表 |
|---|---|
| 1 | Pie Chart 由于名称表示此图表用于以饼图格式表示数据。 |
| 2 | Line Chart 此图表用于以线图格式表示数据。 |
| 3 | Bar Chart 此图表用于以条形图格式表示数据。 |
| 4 | Area Chart 此图表用于以面积图形式表示数据。 |
1.Ext.js 饼图
描述
此图表用于表示饼图格式的数据。它是一个极坐标图。
语法
这里是简单的语法。
 Ext.create('Ext.chart.PolarChart', {
 series: [{
   Type: 'pie'
   ..
   }]
   render and other properties.
 });
例
下面是一个简单的例子显示用法。
<!DOCTYPE html>
<html>
<head>
   <link href="https://cdnjs.cloudflare.com/ajax/libs/extjs/6.0.0/classic/theme-classic/resources/theme-classic-all.css" rel="stylesheet" />
   <script type="text/javascript" src="https://cdnjs.cloudflare.com/ajax/libs/extjs/6.0.0/ext-all.js"></script>
   <script type="text/javascript" src="https://cdnjs.cloudflare.com/ajax/libs/extjs/6.0.0/packages/charts/classic/charts.js"></script>
   <link href="https://cdnjs.cloudflare.com/ajax/libs/extjs/6.0.0/packages/charts/classic/classic/resources/charts-all.css" rel="stylesheet" />
   <script type="text/javascript">
      Ext.onReady(function() {
         Ext.create('Ext.chart.PolarChart', {
             renderTo: document.body,
             width: 600,
             height: 300,
             store: {
                 fields: ['name', 'g1'],
                 data: [
                     {"name": "Item-0", "g1": 57},
                     {"name": "Item-1", "g1": 45},
                     {"name": "Item-2", "g1": 67}
                 ]
             },

             //configure the legend.
             legend: {
                 docked: 'bottom'
             },

             //describe the actual pie series.
             series: [{
                 type: 'pie',
                 xField: 'g1',
                 label: {
                     field: 'name'
                 },
                 donut: 30 // increase or decrease for increasing or decreasing donut area in middle.
             }]
         });
      });
   </script>
</head>
<body>
</body>
</html>
2. Ext.js 折线图
描述
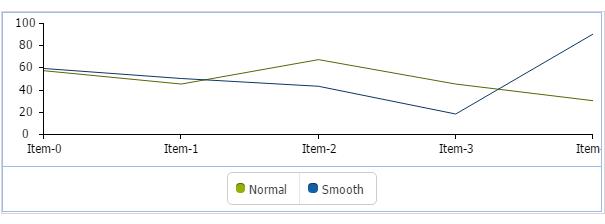
此图表用于以线图格式表示数据。 它是一个笛卡尔图表。
语法
这里是简单的语法。
Ext.create('Ext.chart.CartesianChart',{
   series: [{
      type: 'line',
      xField: 'name',
      yField: 'G1'
      }]
      render, legend and other properties
});
例
下面是一个简单的例子显示用法。
<!DOCTYPE html>
<html>
<head>
   <link href="https://cdnjs.cloudflare.com/ajax/libs/extjs/6.0.0/classic/theme-classic/resources/theme-classic-all.css" rel="stylesheet" />
   <script type="text/javascript" src="https://cdnjs.cloudflare.com/ajax/libs/extjs/6.0.0/ext-all.js"></script>
   <script type="text/javascript" src="https://cdnjs.cloudflare.com/ajax/libs/extjs/6.0.0/packages/charts/classic/charts.js"></script>
   <link href="https://cdnjs.cloudflare.com/ajax/libs/extjs/6.0.0/packages/charts/classic/classic/resources/charts-all.css" rel="stylesheet" />
   <script type="text/javascript">
      Ext.onReady(function() {
         Ext.create('Ext.chart.CartesianChart', {
             renderTo: document.body,
             width: 600,
             height: 200,
             store: {
                 fields: ['name', 'g1', 'g2'],
                 data: [
                        {"name": "Item-0", "g1": 57, "g2": 59},
                        {"name": "Item-1", "g1": 45, "g2": 50},
                        {"name": "Item-2", "g1": 67, "g2": 43},
                        {"name": "Item-3", "g1": 45, "g2": 18},
                        {"name": "Item-4", "g1": 30, "g2": 90}

                 ]
             },

             legend: {
                 docked: 'bottom'
             },

             //define x and y axis.
             axes: [{
                 type: 'numeric',
                 position: 'left'
             }, {
                 type: 'category',
                 visibleRange: [0, 1],
                 position: 'bottom'
             }],

             //define the actual series
             series: [{
                 type: 'line',
                 xField: 'name',
                 yField: 'g1',
                 title: 'Normal'
             }, {
                 type: 'line',
                 xField: 'name',
                 yField: 'g2',
                 title: 'Smooth'
             }]
         });
      });
   </script>
</head>
<body>
</body>
</html>
这将产生以下结果
3. Ext.js 条形图
描述
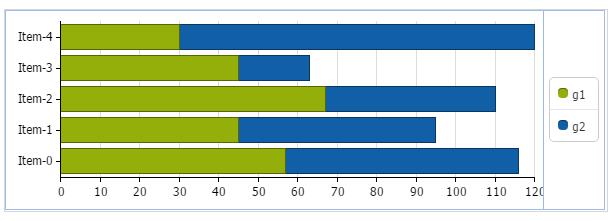
此图表用于以条形图格式表示数据。 它是一个笛卡尔图表。
语法
这里是简单的语法。
Ext.create('Ext.chart.CartesianChart',{
   series: [{
      type: 'bar',
      xField: 'name',
      yField: 'G1'
      }]
      render, legend and other properties
});
例
下面是一个简单的例子显示用法。
<!DOCTYPE html>
<html>
<head>
   <link href="https://cdnjs.cloudflare.com/ajax/libs/extjs/6.0.0/classic/theme-classic/resources/theme-classic-all.css" rel="stylesheet" />
   <script type="text/javascript" src="https://cdnjs.cloudflare.com/ajax/libs/extjs/6.0.0/ext-all.js"></script>
   <script type="text/javascript" src="https://cdnjs.cloudflare.com/ajax/libs/extjs/6.0.0/packages/charts/classic/charts.js"></script>
   <link href="https://cdnjs.cloudflare.com/ajax/libs/extjs/6.0.0/packages/charts/classic/classic/resources/charts-all.css" rel="stylesheet" />
   <script type="text/javascript">
      Ext.onReady(function() {
         Ext.create('Ext.chart.CartesianChart', {
            renderTo: document.body,
            width: 600,
            height: 200,
            flipXY: true,
            store: {
              fields: ['name', 'g1', 'g2'],
              data: [
                     {"name": "Item-0", "g1": 57, "g2": 59},
                     {"name": "Item-1", "g1": 45, "g2": 50},
                     {"name": "Item-2", "g1": 67, "g2": 43},
                     {"name": "Item-3", "g1": 45, "g2": 18},
                     {"name": "Item-4", "g1": 30, "g2": 90}
              ]
            },

            //set legend configuration
            legend: {
              docked: 'right'
            },

            //define the x and y-axis configuration.
            axes: [{
              type: 'numeric',
              position: 'bottom',
              grid: true,
              minimum: 0
            }, {
              type: 'category',
              position: 'left'
            }],

            //define the actual bar series.
            series: [{
              type: 'bar',
              xField: 'name',
              yField: ['g1', 'g2'],
              axis: 'left'
            }]
         });
      });
   </script>
</head>
<body>
</body>
</html>
这将产生以下结果
4. Ext.js 区域图
描述
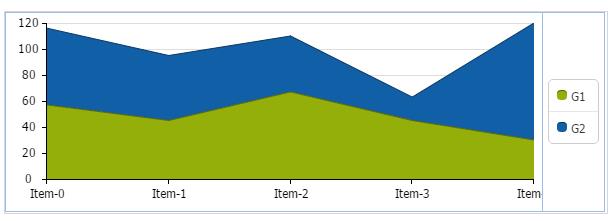
此图表用于以区域图形格式表示数据。 它是一个笛卡尔图表。
语法
这里是简单的语法。
Ext.create('Ext.chart.CartesianChart',{
   series: [{
      type: 'area',
      xField: 'name',
      yField: 'G1'
      }]
      render, legend and other properties
});
例
下面是一个简单的例子显示用法。
<!DOCTYPE html>
<html>
<head>
   <link href="https://cdnjs.cloudflare.com/ajax/libs/extjs/6.0.0/classic/theme-classic/resources/theme-classic-all.css" rel="stylesheet" />
   <script type="text/javascript" src="https://cdnjs.cloudflare.com/ajax/libs/extjs/6.0.0/ext-all.js"></script>
   <script type="text/javascript" src="https://cdnjs.cloudflare.com/ajax/libs/extjs/6.0.0/packages/charts/classic/charts.js"></script>
   <link href="https://cdnjs.cloudflare.com/ajax/libs/extjs/6.0.0/packages/charts/classic/classic/resources/charts-all.css" rel="stylesheet" />
   <script type="text/javascript">
      Ext.onReady(function() {
         Ext.create('Ext.chart.CartesianChart', {
             renderTo: document.body,
             width: 600,
             height: 200,
             store: {
                 fields: ['name', 'g1', 'g2'],
                 data: [
                     {"name": "Item-0", "g1": 57, "g2": 59},
                     {"name": "Item-1", "g1": 45, "g2": 50},
                     {"name": "Item-2", "g1": 67, "g2": 43},
                     {"name": "Item-3", "g1": 45, "g2": 18},
                     {"name": "Item-4", "g1": 30, "g2": 90}
                 ]
             },

             legend: {
                 docked: 'right'
             },

             axes: [{
                 type: 'numeric',
                 position: 'left',
                 grid: true
             }, {
                 type: 'category',
                 position: 'bottom',
                 visibleRange: [0,5]
             }],

             series: [{
                 type: 'area',
                 xField: 'name',
                 yField: ['g1', 'g2'],
                 title: ['G1', 'G2']
             }]
         });
      });
   </script>
</head>
<body>
</body>
</html>
这将产生以下结果


 9615


 扫一扫


 被折叠的 条评论
为什么被折叠?
 到【灌水乐园】发言


